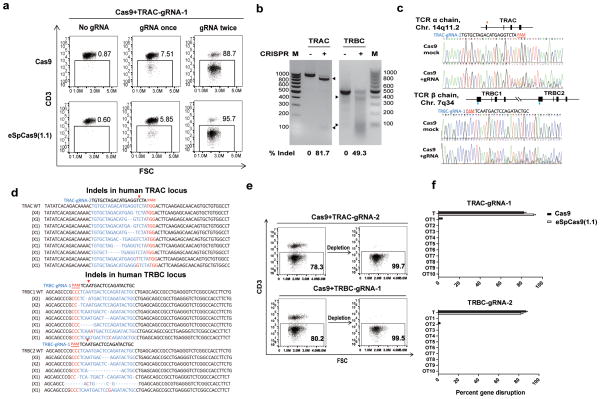
Figure 1. CRISPR/Cas9 mediates efficient TCR disruption in T cells.
(a) CD3 expression of T cells after sequential CRISPR RNA electroporation with Cas9 and eSpCas9 (1.1). (Healthy donors, n=5) (b) Amount of TCR-targeted gene disruption measured by a mismatch-selective T7E1 surveyor nuclease assay on DNA amplified from the cells shown. The calculated amount of targeted gene disruption in TRAC and TRBC is shown at the bottom. Arrows indicate expected bands. (c) A diagram of the human locus encoding the TCR α and β CRISPR gRNA targeting sites within the genomic locus of the TCR α and β constant region. Multiple peaks in the Sanger sequencing results show the CRISPR-mediated events of NHEJ at the TRAC and TRBC genomic loci. Each exon is shown by a block. Red arrow: sense strand gRNA targeting site; blue arrow: anti-sense strand gRNA targeting site. (d) Indels and insertions observed by clonal sequence analysis of PCR amplicons after CRISPR-mediated recombination of the TCR α and β locus. Red arrow indicates putative cleavage site. (e) CD3 expression on purified TCRneg population (n=3). (f) Off-target mutagenesis measurement of TRAC and TRBC. Indel frequencies were measured by TIDE analysis (n=3). All TIDE analyses below the detection sensitivity of 1.5% were set to 0%. Bars, SE, n = 3;T: target; OT: Off-target.

