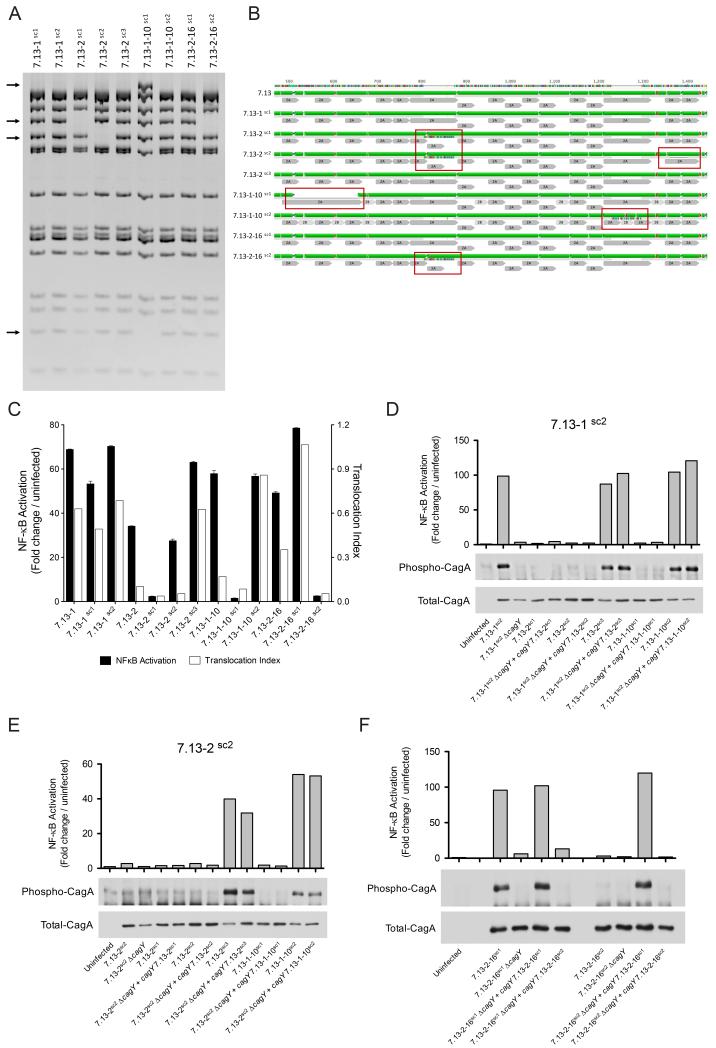
Fig 5. H. pylori gerbil-adapted strains represent panmictic populations harboring diverse cagY rearrangements.
(A) Representative cagY RFLP profiles of H. pylori single colonies generated from strains 7.13-1, 7.13-2, 7.13-1-10, and 7.13-2-16. Arrows denote differential bands between RFLP profiles. (B) Alignment and predicted secondary structure of H. pylori CagY parental strain 7.13 and derivative single colony strains. Red boxes highlight gain or loss of motifs 2A and/or 2B compared with parental strain 7.13. Green: alpha helix; purple: beta-sheets, and red: beta turns. Repeat motifs 2A and 2B are in gray. (C) NF-κB activation (black bars) and CagA translocation (white bars) induced by H. pylori strains and their corresponding single colony isolates. NF-κB activation, and CagA translocation induced by H. pylori strains 7.13-1sc2 (D) and 7.13-2sc2 (E) genetically complemented with different cagY genes. (F) NF-κB activation and CagA translocation induced by H. pylori strains 7.13-2-16sc1 and 7.13-2-16sc2 complemented with either an endogenous cagY motif or with a cagY motif derived from the sibling strain.

