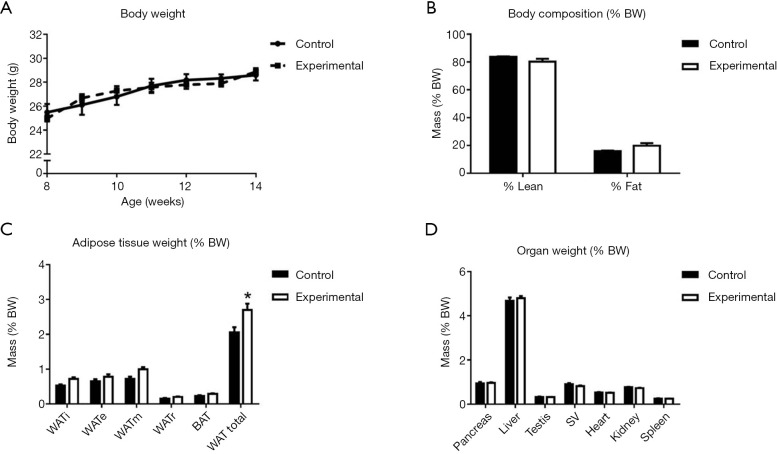
Figure 2.
Growth and body composition. BW curve and body composition in experimental and control mice. (A) Weekly BW from 8 to 14 weeks of age; (B) total lean and fat mass as a percentage of BW at 13 weeks of age; (C) mass of dissected adipose tissue depots (% BW) at 14 weeks of age; (D) mass of dissected organs (% BW) at 14 weeks of age. Control group n=8; experimental group n=7. *, P<0.05; data expressed as mean ± SE. BW, body weight; WAT, white adipose tissue; BAT, brown adipose tissue; SV, seminal vesicle.

