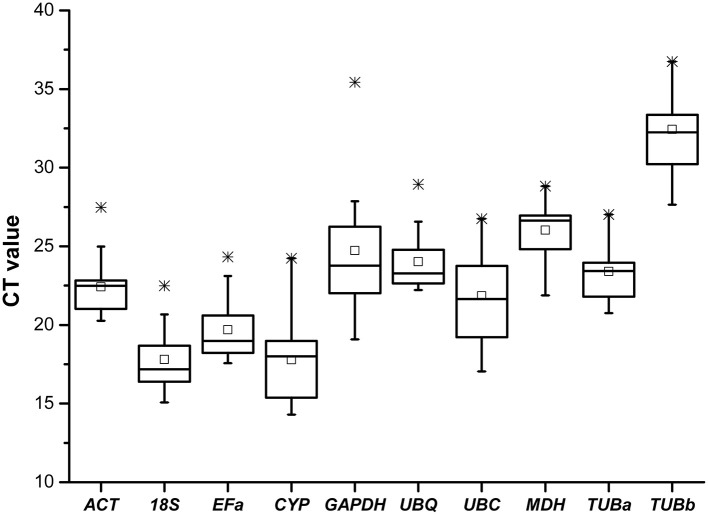
Figure 1.
Cycle threshold (Ct) values of 10 candidate reference genes across all samples. The final Ct-value of each sample was the mean of three biological and technical replicates. Box graph indicates the interquartile range. A line across the box is shown as the median. Lower and upper dashes represent the minimum and maximum values, respectively; middle panes show the mean values. *Represents the extremum value.

