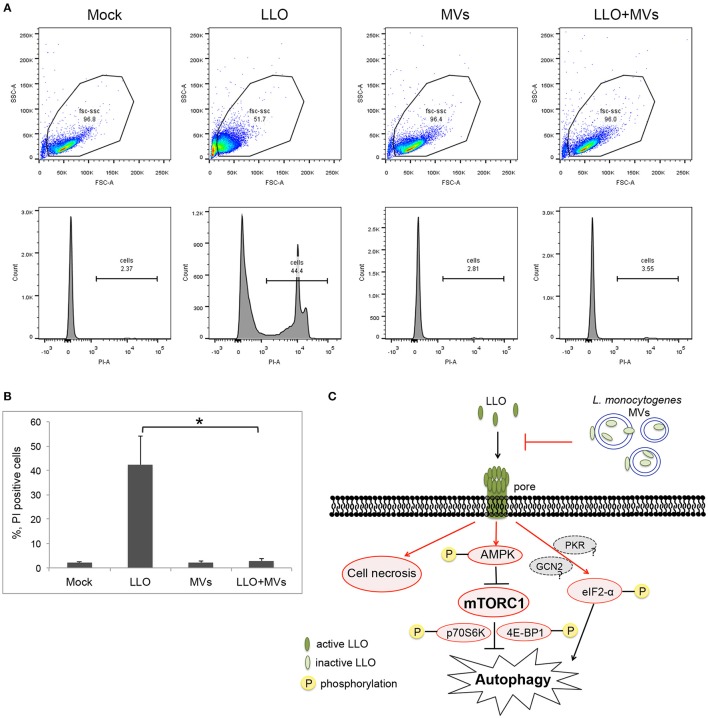
Figure 12.
Analysis of pore formation on the cell membrane using propidium iodide influx assay by flow cytometry analysis. (A,B) HEK293 cells, pretreated with L. monocytogenes MVs (4.5 h) and subsequently with 250 ng/ml LLO for 1 h, were stained with 5 μg/ml propidium iodide (PI) and analyzed by flow cytometry after 15 min incubation with PI. (A) Upper panels show cytograms with gating plotting forward scatter (FSC), representing size of cells, against side scatter (SSC) representing granularity. 20,000 events were analyzed by flow cytometry. Lower panels represent histograms showing propidium iodide intake by cells. Mock, treated with 1 × PBS; LLO, treated with pure LLO for 1 h; MVs, treated with MVs for 4.5 h; LLO+MVs, pre-treated with MVs for 4.5 h and treated with LLO for 1 h. (B) PI positive cells indicating cell membrane damage were quantified from three independent experiments. *P < 0.05, Student's t-test. (C) A schematic model for inhibition of LLO-induced pore formation, autophagy and cell necrosis by L. monocytogenes MVs. Shapes and arrows in red color represent data from the current study; shapes and arrows in black and dark gray represent data from the pervious studies. Inactive, oxidized LLO is shown in light green color; active, reduced LLO is shown in dark green color.

