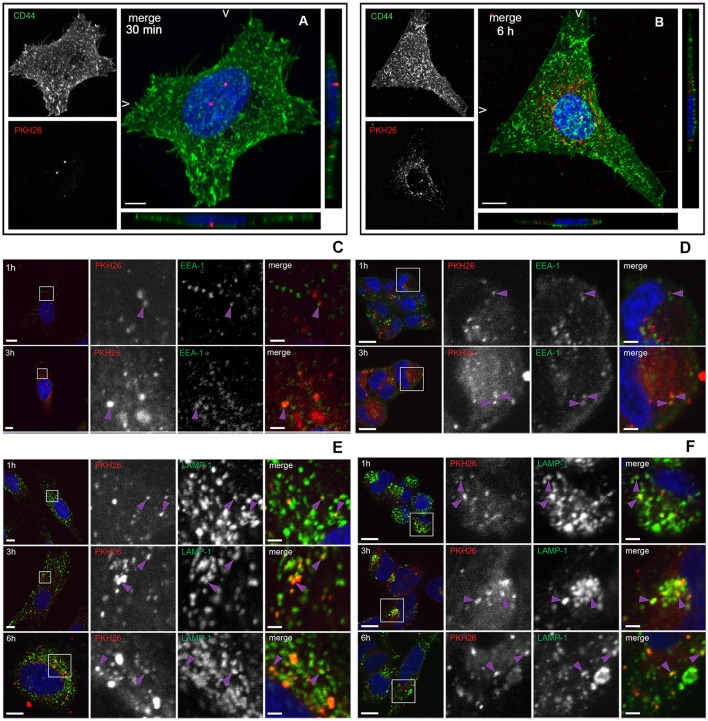
Figure 3.
Internalization and trafficking of MVs inside HeLa and HEK293 cells. (A,B) Confocal microscopic images showing MVs taken up by HeLa cells after 30 min (A) or 6 h (B). HeLa cells were treated with 100 μg of PKH26 pre-labeled MVs (red), and stained with CD44 (cell surface marker; green) and DAPI (nuclei; blue). The left panels show images from CD44 staining only (green) and PKH26 staining only (red). The right panels show merged images (maximum intensity projections and slice views). Scale bar: 10 μm. (C–F) Confocal microscopic images showing colocalization of MVs with early endosomes and lysosomes. HeLa cells (C,E) and HEK293-GFP-LC3 cells (D,F) were treated with 100 μg of PKH26 pre-labeled MVs (red) for different time points and stained with anti-EEA-1 antibody (green) and DAPI (blue) (C,D) or with anti-LAMP-1 antibody (green) and DAPI (blue) (E,F). Colocalization is indicated with purple arrowheads. Left panels show an overview of the cell and the magnified fields in squares are presented in the panels to the right, where MVs and EEA-1 or LAMP-1 are shown individually and as a merged image of all three channels, as indicated. Scale bar: 10 μm (overview) and 2 μm (zoom).

