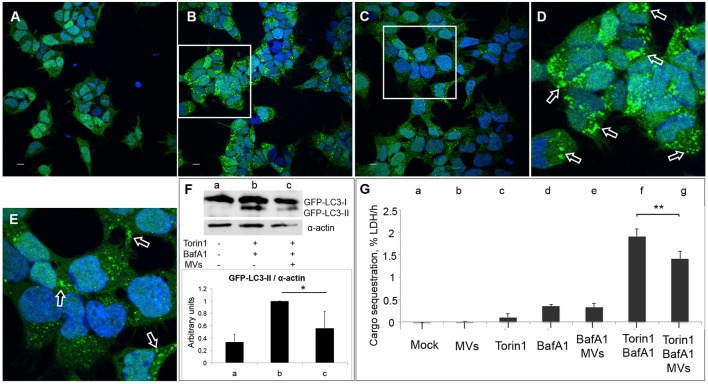
Figure 7.
MVs inhibit Torin1-stimulated autophagy. HEK293-GFP-LC3 cells were incubated with 250 μg MVs for 3 h prior to adding Torin1 (50 nM) in the presence of Bafilomycin A1 (BafA1; 100 nM) for 3 h to stimulate autophagosome formation. Confocal images show (A) mock-treated (PBS) control cells, (B) cells treated with Torin1 and BafA1, (C) cells treated with MVs followed by Torin1 + BafA1 treatment. (D,E) represent magnified areas of the white squares in (B) and (C), respectively. Scale bar: 10 μm. Green dots represent GFP-LC3 puncta, indicated with arrows (only a few of the puncta are indicated with arrows for the purpose of showing examples. Many of the dots are so large that they are partly merging with one another—a common feature observed after treatment with an autophagy inducer together with BafA1). (F) Immunoblot shows LC3 lipidation profile of: (a) mock-treated cells, (b) cells treated with Torin1 + BafA1, and (c) cells treated with MVs + Torin1 + BafA1 (upper panel). The membrane was reprobed using anti-α-actin antibody as an internal control. The ratio of GFP-LC3-II to α-actin was quantified from three independent experiments, normalized and presented in arbitrary units (lower panel). (G) LDH sequestration assay of HEK293-GFP-LC3 cells incubated with (a) Mock (PBS and DMSO), (b) MVs, (c) Torin1, (d) BafA1, (e) MVs + BafA1, (f) Torin1 + BafA1, and (g) MVs + Torin1 + BafA1. Values represent mean autophagic sequestration rates (% LDH/h) ± SEM from three independent experiments. **P < 0.01, *P < 0.05, Student's t-test.

