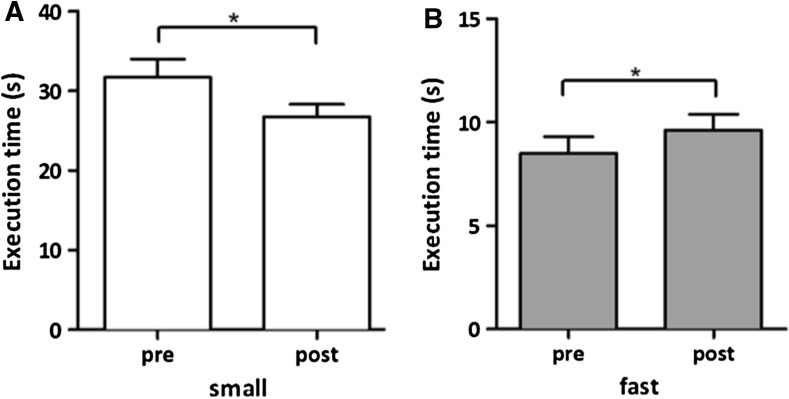
Fig. 3.
The mean task execution times for the gait protocol (only shown for significant differences) before and after stimulation for the a small steps and b fast walking normal step size condition in seconds. The error bars signify the SEM. The asterisks indicate a significant difference between pre- and post-measurements

