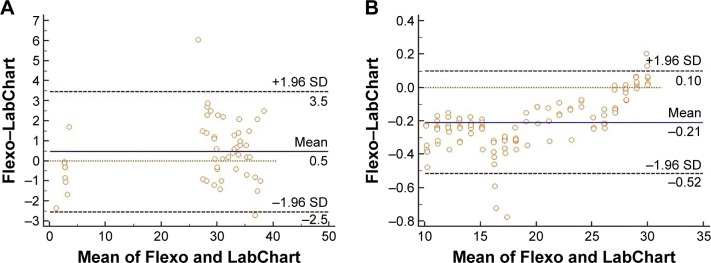
Figure 4.
Bland-Altman plots for absolute reliability of parameters estimation between the Flexo and LabChart.
Notes: (A) Bland–Altman plots for absolute reliability (means vs differences) of leak estimation between the Flexo and LabChart. (B) Bland–Altman plots for absolute reliability (means vs differences) of pressure estimation between the Flexo and LabChart.
Abbreviation: SD, standard deviation.

