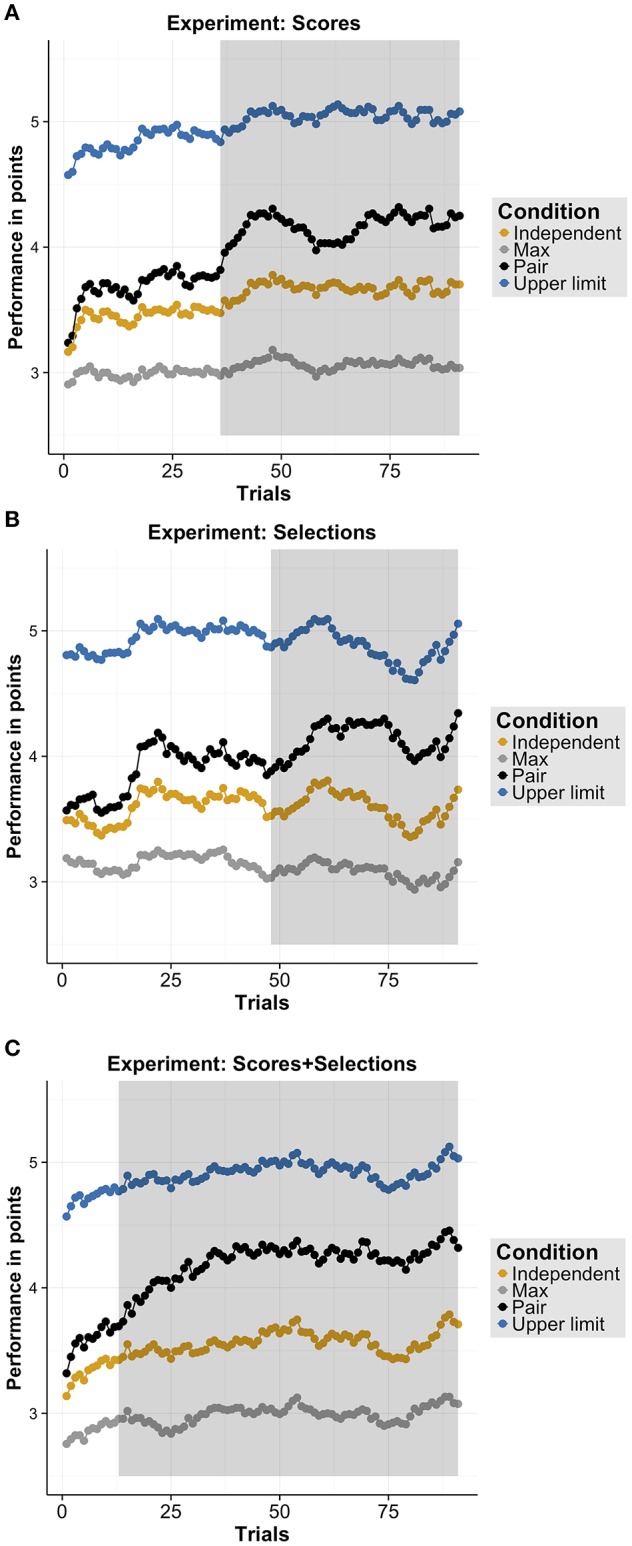
Figure 2.

Results overview. (A–C) Performance in points for each measure (i.e., “Independent,” “Max,” “Pair,” “Upper limit”), separately for each Experiment: (A) Scores (Experiment 1), (B) Selections (Experiment 2), and (C) Selection+Scores (Experiment 3). Shaded regions indicate significant clusters using cluster permutation tests for comparing the pair's performance with the independent performance.
