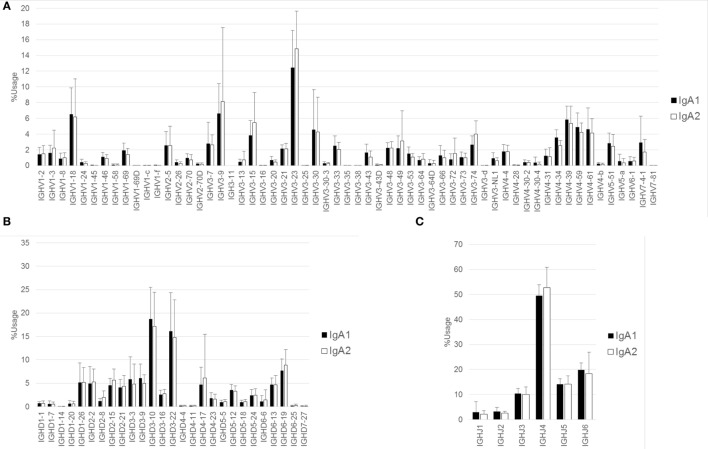
Figure 3.
Comparison of usage of IGHV, IGHD, and IGHJ among IgA subclasses. Mean percentage usages of IGHV (A), IGHD (B), and IGHJ (C) were compared between IgA1 and IgA2. Bars and error bars indicate mean percentage usage and SD of 12 healthy individuals, respectively. There were significant differences in IGHV3–35 (P < 0.001), IGHV3–74 (P < 0.05), and IGHV4–34 (P < 0.01).

