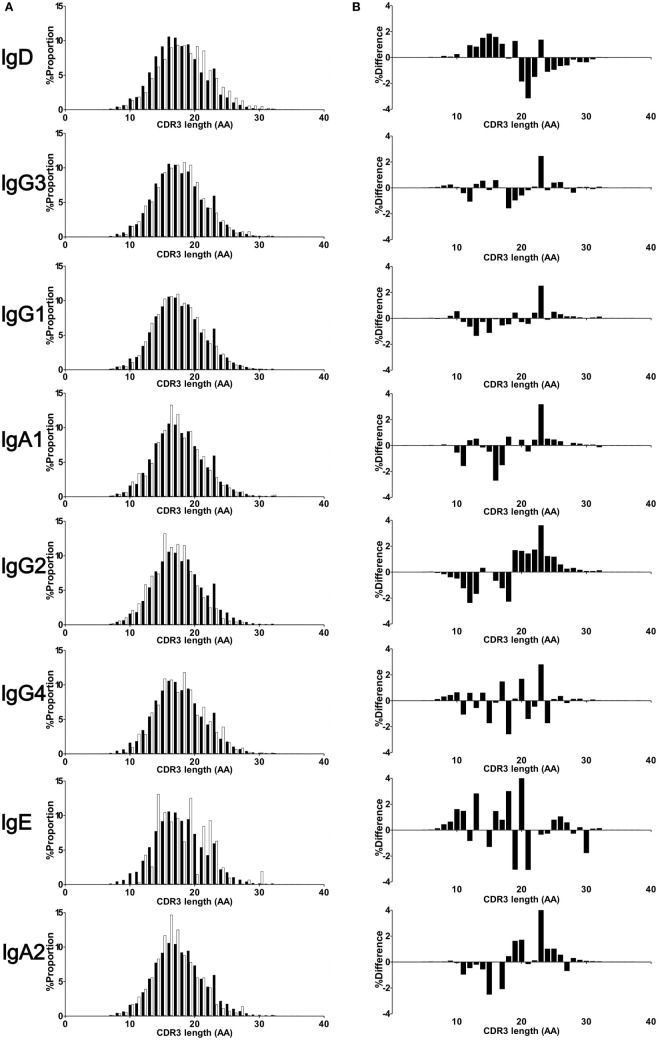
Figure 4.
CDR3 length of isotypes and subclasses. Deduced amino acid sequence of CDR3 region of IgM, IgD, IgG3, IgG1, IgA1, IgG2, IgG4, IgE, and IgA2 were collected from 12 individuals. The CDR3 length was calculated based on amino acid sequence from conserved Cys104 to Trp118 or Phe118. Percentage frequencies of each CDR3 length were plotted by a bar plot (A). Closed bar indicates percentage frequencies in CDR3 length of IgM (control), while open bar indicates respective immunoglobulin subclasses. To compare difference in the CDR3 length between immature and mature B cells, difference in the percentage frequencies between IgM and either IgD, IgG, IgA, and IgE or IgM were plotted at each position (B). Negative values in the left half and positive values in right half indicate a shortening of CDR3 length in respective Igs compared with IgM.

