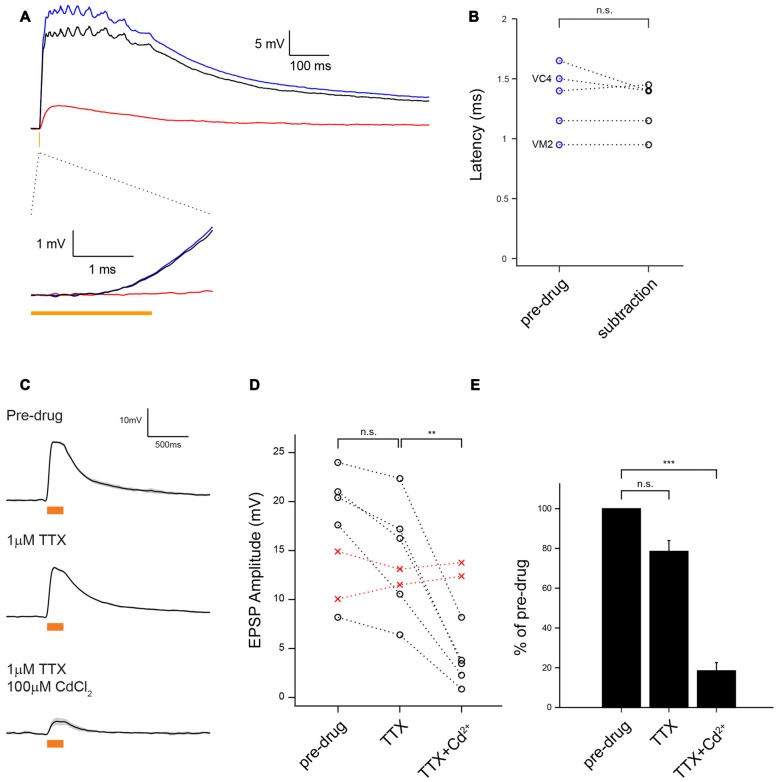
Figure 3.
MZ699-vPNs monosynaptically excite ePNs through chemical synapses. (A) Average voltage traces of ePN depolarization on optogenetic activation of MZ699-Gal4+ neurons with 2 ms 590 nm pulse before (blue) and after perfusion with Cd2+ to block chemical transmission (red); the subtraction trace (black) reveals the chemical synaptic transmission component of the response. (B) The EPSPs latency from the light onset was very brief, consistent with a monosynaptic chemical connection (n = 5,1.33 ± 0.13 ms before Cd2+, 1.27 ± 0.10 ms after Cd2+, p = 0.32). The identities of two ePNs filled with biocytin hydrazide are shown on the left. (C) Example traces showing depolarization of an ePN induced by optogenetic activation of MZ699-Gal4+ neurons before drug application (top), after infusion of 1 μM tetrodotoxin (TTX; middle), and after subsequent infusion of 1 μM TTX and 100 μM Cd2+ (bottom). (D) Depolarization magnitude was slightly reduced with 1 μM TTX (n = 5, p = 0.027, paired t-test) but greatly reduced with subsequent infusion of 1 μM TTX and 100 μM Cd2+ (n = 5, **p < 0.01, paired t-test). Replacement of external saline with a control drug-free saline did not cause any change in EPSP amplitude (red crosses). The glomerular identities of the recorded ePNs are as follows: from the ePN with largest amplitude in pre-drug condition, VM3, VC3, D, DC2 and VA1d for the drug application group (black circle), and VC3 and VA2 for the drug-free saline group (red circles). (E) A bar graph shows the EPSP amplitude normalized by pre-drug responses (n = 5, TTX: 78.54 ± 5.45%, p = 0.017, TTX + Cd2+: 18.48 ± 4.13%, ***p < 0.001, paired t-test).

