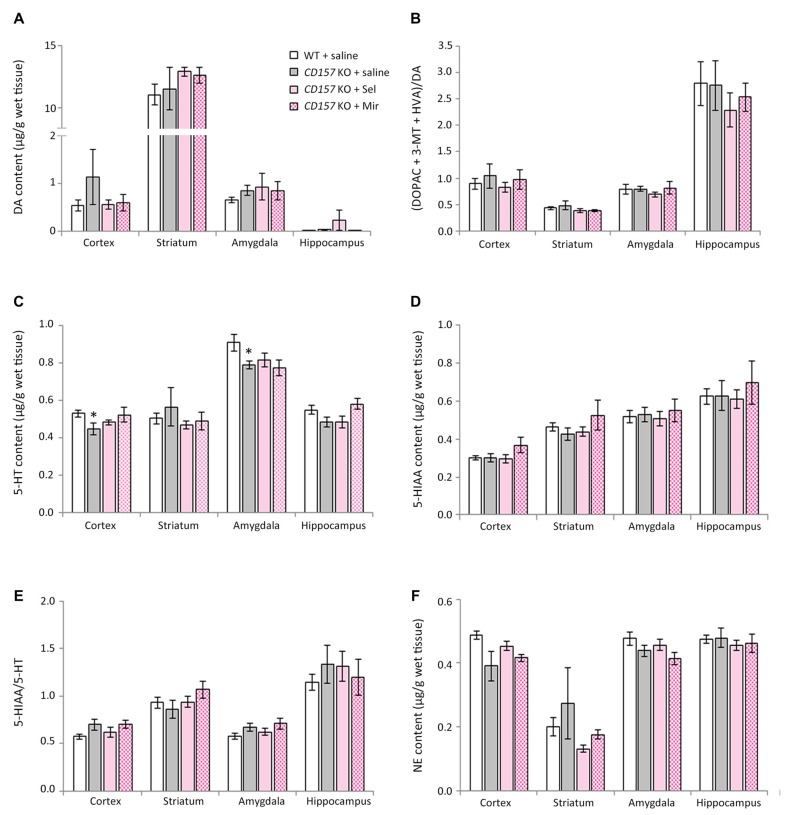
Figure 5.
Changes in DA, 5-HT, NE and their metabolites in several brain regions of WT and CD157 KO mice after the open field test (OFT), and effects of repeated administration of selegiline and mirtazapine. Data are shown for DA (A), ratio of DA metabolites to DA (B), 5-HT (C), 5-HIAA (D), 5-HIAA/5-HT ratio (E) and NE (F) in μg/g wet tissue as the mean ± SEM (n = 8 for saline-treated WT and CD157 KO mice and selegiline-treated CD157 KO mice, n = 4 for mirtazapine-treated CD157 KO mice). *P < 0.05, saline-treated CD157 KO mice vs. saline-treated WT mice (Student’s t-test).

