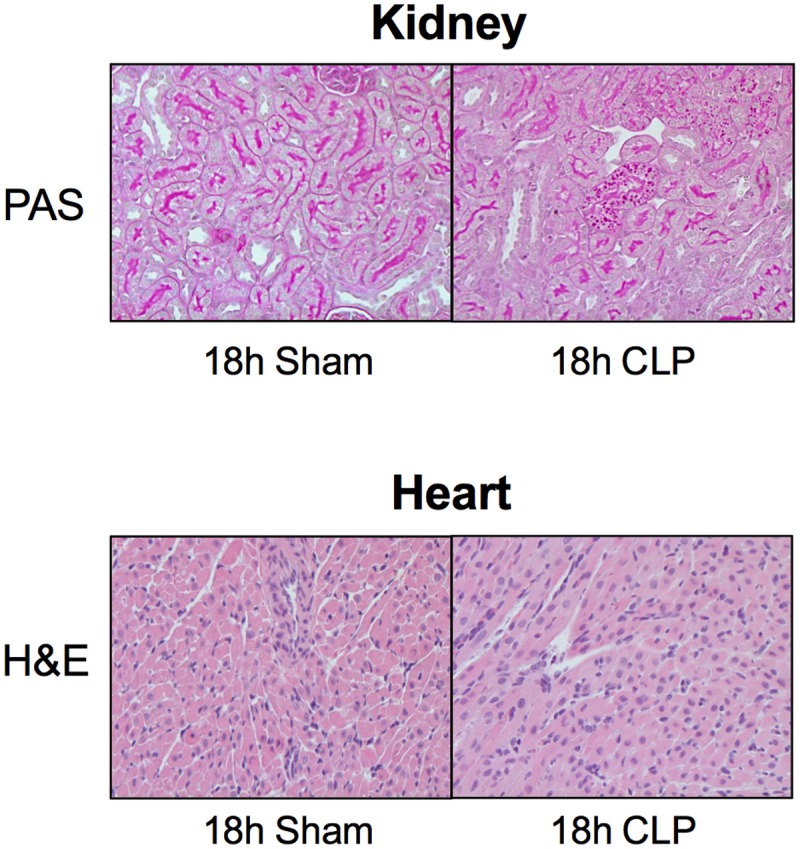
FIGURE 5.

Histology of the kidney and heart. Shown are representative images of the kidney stained with PAS staining and the heart stained with H&E. No morphological changes were observed between Sham and CLP groups (n = 4 per group) other than patchy PAS-positive cytoplasmic droplets within proximal tubules of the kidney. Original magnification = 200×.
