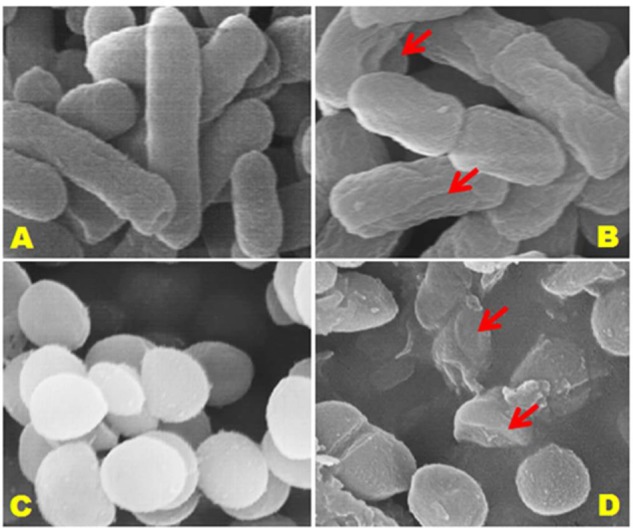
FIGURE 5.

Scanning electron microscopic (SEM) analysis of E. coli 0157:H7 and S. aureus KCTC1621 cells treated with (+)-lariciresinol at MIC. Controls (A,C) showing a regular and smooth surface; whereas treated cells (B,D) arrows showing disruption and cell lysis, respectively.
