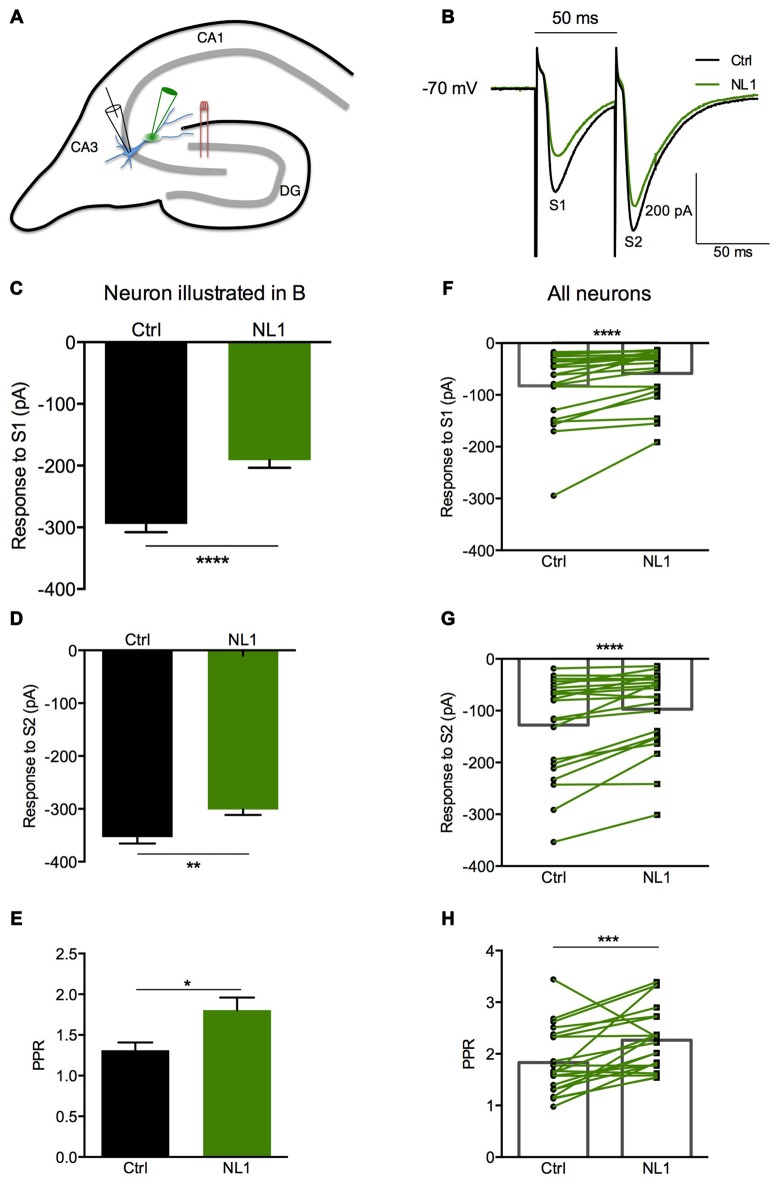
Figure 3.
The NL1 ectodomain produces presynaptic inhibition in CA3 neurons. (A) Schematic diagram of the preparation. Hippocampal CA3 neurons were recorded in voltage-clamp mode (Vh = −70 mV) in whole-cell configuration. The synaptic stimulation of mossy fibers was produced by a bipolar electrode (red), patch electrode (black), and focal puff application of ecto-NL1 (green). N-methyl-D-aspartate (NMDA) receptors were blocked by AP5 (50 μM). GABA receptors were blocked by SR 95531 hydrobromide (gabazine; 10 μM). (B–E) Response of a CA3 neuron to two stimulations (S1 and S2) under control conditions (black) and after puffing ecto-NL1 near the apical dendrite of the recorded neuron (green). (C) The amplitude of the first EPSC decreased from −294.6 ± 13.20 to −191.1 ± 12.46 pA (****p < 0.0001, unpaired t-test; n = 30 sweeps). (D) The amplitude of the second EPSC also decreased but to a lesser extent (from −353.4 ± 12.18 to −301.1 ± 10.47 pA; **p = 0.0019, unpaired t-test; n = 30 sweeps). (E) The PPR, which was calculated as the amplitude of the second EPSC divided by the first, significantly increased (*p = 0.0165, Kolmogorov Smirnov test; n = 30). (F–H) Results for all cells tested (n = 21), with significant decreases for the first (****p < 0.0001) and second (****p < 0.0001) EPSCs (Wilcoxon matched-pairs signed-rank test). (H) Significant increase in the PPR for all cells together (***p = 0.0017, paired t-test; n = 21). In (F–H) bars show the mean values and lines correspond to individual pairs of values.

