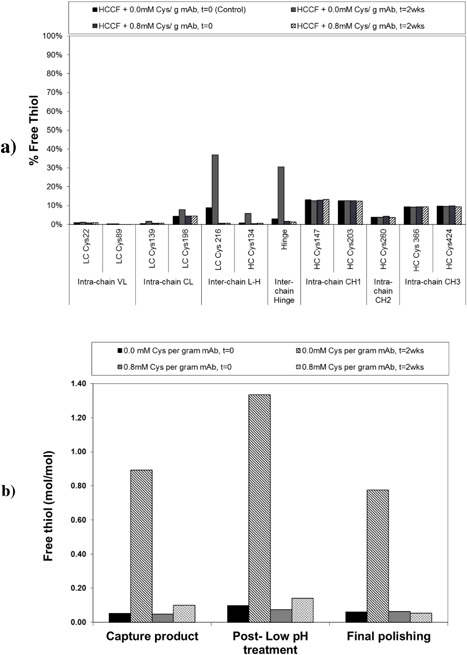
Figure 8.

(a) Mass spectrometry quantification of change in free thiol levels for HCCF at t = 0 and after a 2 week hold at 2–8°C in the presence of 0 and 0.8 mM cystine per gram mAb. (b) Free thiol levels determined by colorimetric assay for purification process intermediates generated from HCCF purified immediately and held for 2 weeks in the presence of no cystine (0 mM) and 0.8 mM cystine per gram mAb.
