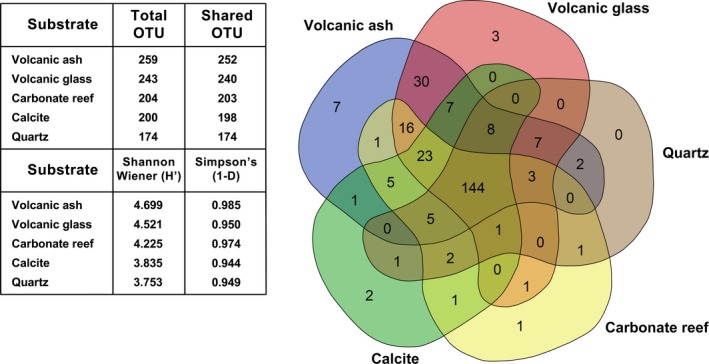
Figure 3.

Relationship between the substrate‐specific and shared operational taxonomic units (OTUs) amongst all five substrates after 3 months. The diagram was constructed using the program VENN (http://bioinformatics.psb.ugent.be/webtools/Venn). Table (left) shows the total number of OTUs per substrate after 3 months (T3), the Shannon–Wiener (H′) and Simpson's (1‐D) diversity indices. The values were calculated by taking the average of OTUs of the ARISA data of the replicate samples of each substrate (n = 6)
