
Figure 5.
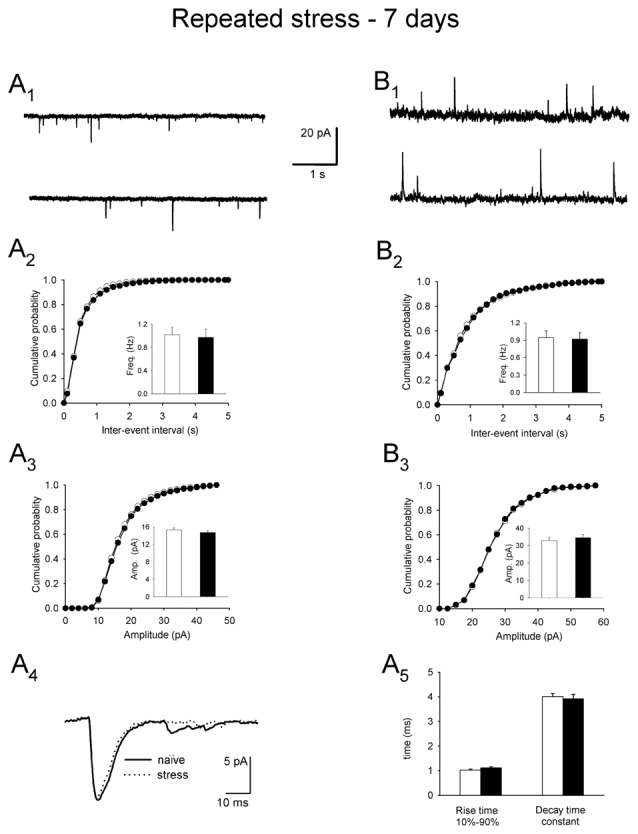
Miniature synaptic currents and plasma corticosterone levels after restraint repeated over 7 days followed by a 24 h delay before recordings. (A1) Representative raw recording of mEPSCs in control (upper trace) and after restraint (lower trace). (A2,A3) Cumulative probability plots of inter-event interval and amplitude distributions in control (white circles/bars) and stress (black circles/bars) conditions. Insets: comparison of the average values ±SEM. (A4) Overlaid average mEPSCs recorded from representative PNCs from a control rat (naïve) and a rat subjected to repeated restraint (stress). (A5) Comparison of the average (±SEM) rise time and decay time constant of mEPSCs in control (white bars) and stress (black bars) conditions. (B1) Representative recording of mIPSCs in control conditions (upper trace) and after restraint (lower trace). (B2,B3) Cumulative probability plots of inter-event interval and amplitude distributions in control (white circles/bars) and stress (black circles/bars) conditions. Insets: comparison of the average values ±SEM.