Figure 1.

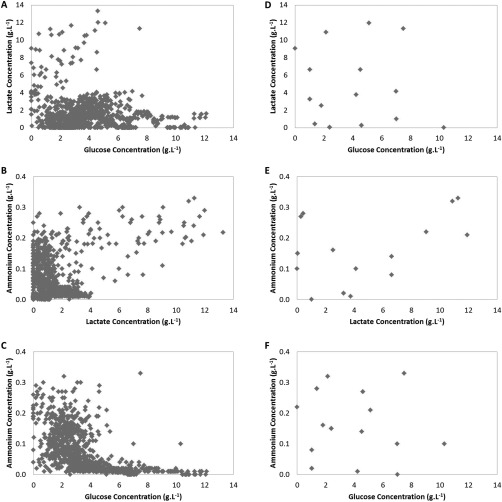
Design space of sample library: glucose (A), lactate (B), and ammonium (C) concentrations of the entire sample library (N = 957). (D), (E), and (F) show the subset of the library selected using the DOE approach (N = 20).

Design space of sample library: glucose (A), lactate (B), and ammonium (C) concentrations of the entire sample library (N = 957). (D), (E), and (F) show the subset of the library selected using the DOE approach (N = 20).