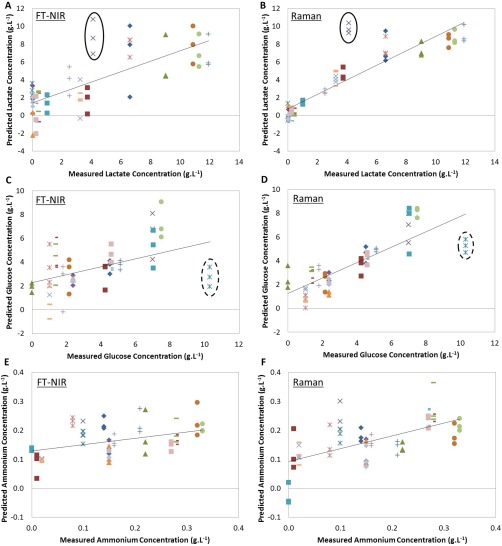
Figure 2.

Measured versus predicted plots for individual PLS models: (A) lactate by NIR, (B) lactate by Raman, (C) glucose by NIR, (D) glucose by Raman, (E) ammonium by NIR, (F) ammonium by Raman. Markers indicate replicate measurements from one sample; solid ellipse identifies sample 1 and dotted ellipse sample 2 (N = 60 for Raman models and N = 59 for NIR models). Solid black line: line of best fit (R2CV).
