
Figure 1.
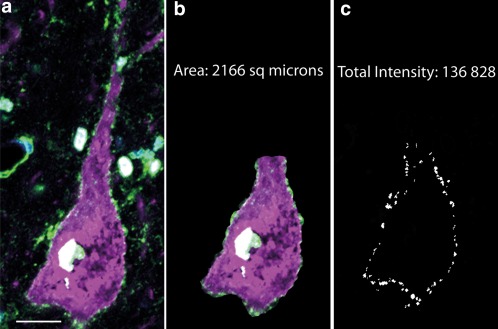
Analysis of Kv3.1b labeling in neuronal cell membranes. Sections stained for Kv3.1b were visualized and images taken using the 63x objective of a Zeiss LSM710 confocal microscope. (a) Pyramidal neuron in macaque motor cortex stained for SMI32 (magenta) and Kv3.1b Millipore antibody (green) and DAPI (blue). (b) The same neuron shown in a, indicating the area of cell soma and base of apical dendrite that were manually delineated using the Metamorph image analysis software. The cross‐sectional area was measured. This selection was color separated and thresholded. The staining of the nucleus was not included in the analysis. (c) Image mask showing the selected area of membrane. The white regions making up the mask represent all the regions of membrane labeling that were above a standard threshold value used for all images. The intensity of Kv3.1b staining underneath the mask was measured on the original image (a) and summed to provide the total intensity measure for the cell membrane of that neuron. Scale bar: 20 µm [Color figure can be viewed at wileyonlinelibrary.com]