Figure 5.

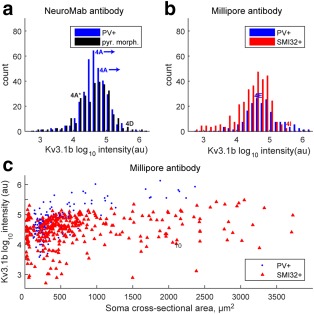
Quantification of Kv3.1b labeling in macaque motor cortex. (a). Distribution of total intensities for staining with the NeuroMab antibody in 347 parvalbumin‐positive putative interneurons (PV+, blue bars) in sections taken from macaque M1. The blue labels “4A” indicates the intensity of the two PV + labeled marked with arrows in Figure 4a. The black bars indicate the staining intensity of 282 neurons with pyramidal cell morphology. The black label 4A indicates the intensity value for the two pyramidal cells marked with * in Figure 4a (the values were very similar for the two cells). The value for another pyramid in Figure 3d is also marked. (b) Distribution of total intensities for staining with the Millipore antibody in 177 parvalbumin‐positive neurons (PV+) is shown as blue bars. The blue marker 4E indicates intensity value for the PV + labeled neuron shown in Figure 4e. The red bars indicate Kv3.1b staining intensity for 329 neurons colabeled with the pyramidal cell marker SMI32. The red marker 4I indicates intensity value for the SMI32‐labeled neuron shown in Figure 4i. Nearly all of the neurons expressing SMI32 showed clear Kv3.1b staining. Note the overlap in the range of Kv3.1b staining intensities in both a and b. (c) The intensity of Kv3.1b staining with the Millipore antibody has been plotted against the soma cross‐sectional area of each labeled cell for PV‐ (blue circles) and SMI32‐positive neurons (red triangles). Note the presence of a few very large pyramidal cells [Color figure can be viewed at wileyonlinelibrary.com]
