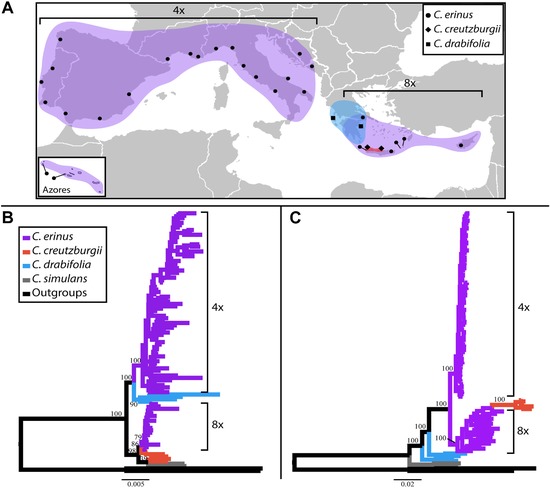
Figure 1.

Sample localities and comparison of concatenated analyses. (A) Occurrence map of lineages under investigation. Colors are consistent with those in panels B and C, with tetraploid and octoploid Campanula erinus lineages labeled as such on the map. Circles indicate sampled populations of C. erinus, diamonds indicate sampling localities of C. creutzburgii populations, and squares indicate sampling localities of C. drabifolia populations included in this study. (B) Results from maximum likelihood analysis of plastome dataset. Numbers at nodes indicate bootstrap support for relationships and clades discussed in the text. Scale bar indicates nucleotide substitutions per site. (C) Results from maximum likelihood analysis of concatenated nuclear dataset. Numbers at nodes indicate bootstrap support for relationships and clades discussed in the text.
