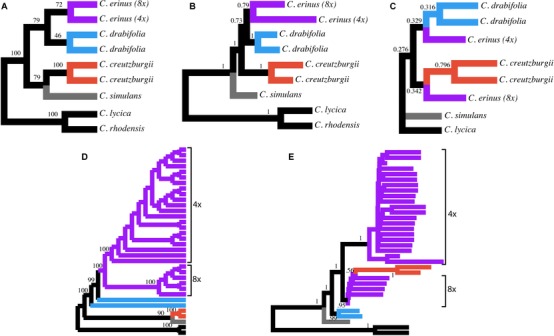
Figure 2.

Comparison of species‐tree analyses. (A) Species‐tree topology estimated with SVDquartets when individuals were assigned to the major lineages recovered with concatenation analyses (see Fig. 1). Numbers at nodes indicate bootstrap support values of relationships. (B) Species‐tree topology estimated with ASTRAL‐II when individuals were assigned to lineages, as in panel A. (C) Primary concordance tree from Bayesian Concordance Analysis in Bucky. Numbers indicate concordance factors and are, thus, estimates of the proportion of the genome for which a relationship is true. (D) Topology estimated with SVDquartets when individuals were assigned to separate populations, rather than the major lineages as in panel A. Numbers indicate bootstrap support values. (E) Topology estimated with ASTRAL‐II when individuals were assigned to separate populations. Numbers indicate local posterior probability support values. Branch lengths shown in coalescent units.
