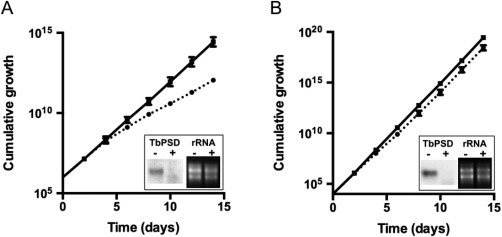
Figure 5.

Growth of TbPSD‐depleted parasites.
A. Growth of control (solid lines) and TbPSD‐depleted (dotted lines) procyclic forms. The data points represent mean values ± standard deviations from three separate experiments involving two different clones.
B. Growth of control (solid lines) and TbPSD‐depleted (dotted lines) bloodstream forms. The data points represent mean values ± standard deviations from three experiments using the same clone. For some data points, the error bars are smaller than the symbols. The insets in A and B show Northern blot analyses of TbPSS2 mRNA levels (left two lanes) in parasites incubated in the absence (−) or presence (+) of tetracycline for 2 days. rRNA levels are shown as loading controls (right two lanes).
