
Figure 1.
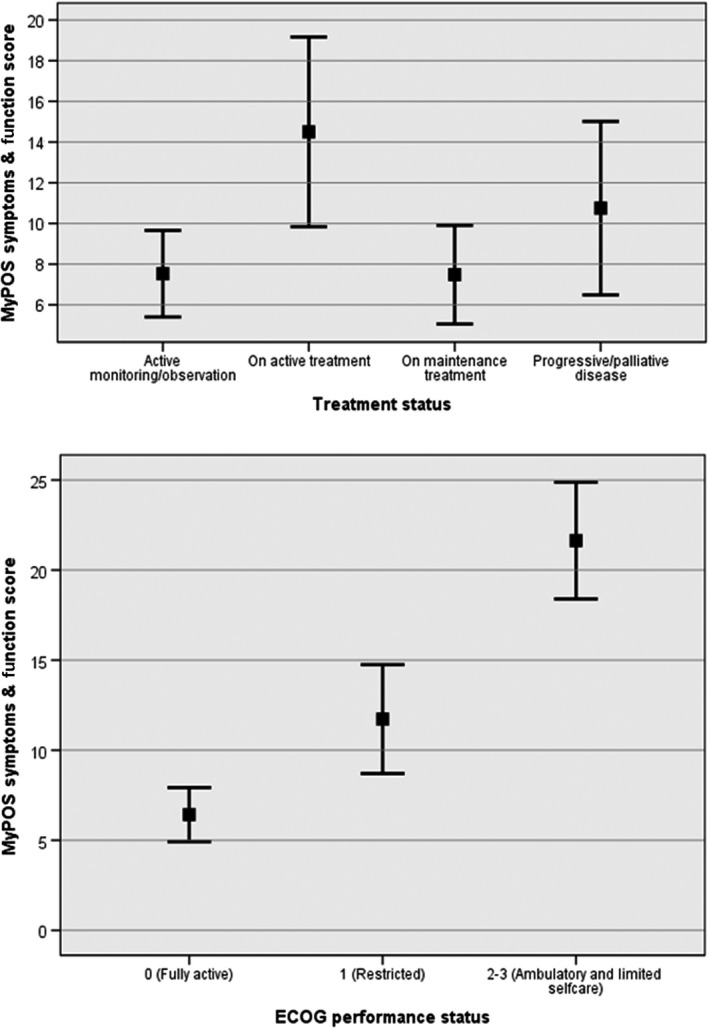
Known group comparisons showing MyPOS symptoms and function subscale scores (mean and 95% CI) by treatment status and ECOG performance status (n=120)
Official websites use .gov
A
.gov website belongs to an official
government organization in the United States.
Secure .gov websites use HTTPS
A lock (
) or https:// means you've safely
connected to the .gov website. Share sensitive
information only on official, secure websites.
Known group comparisons showing MyPOS symptoms and function subscale scores (mean and 95% CI) by treatment status and ECOG performance status (n=120)