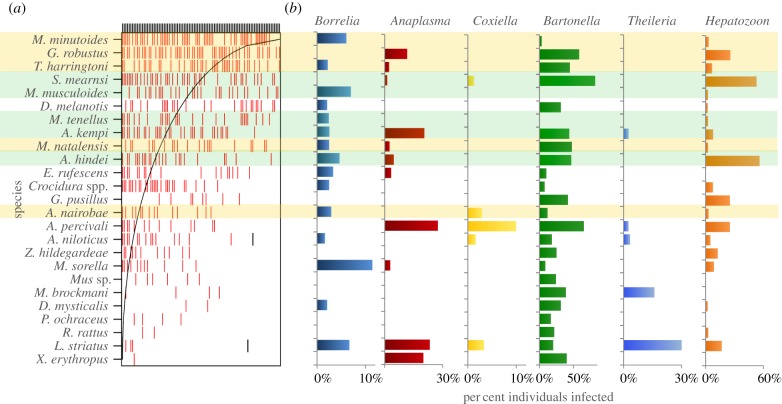
Figure 2.
Panel (a) shows the presence per site of each small mammal species. Rows are species and columns are sites; the presence of each species at a given site is depicted with a red vertical bar. (Nestedness plot constructed using the ‘nestedtemp’ function in the ‘vegan’ package.) This reveals a strongly nested assemblage structure, with some species (e.g. M. minutoides and G. robustus) present at both higher diversity sites (on left) and lower-diversity sites (on right), and other species present only in a subset of relatively high-diversity sites (e.g. L. striatus). The grey ‘boundary line’ shows expected distribution if species were perfectly nested, such that absences above and to the left of the line, and presences below and to the right of the line are both unexpected with a perfectly nested distribution. If species that were highly generalist across sites also tended to have more pathogens, we would expect that the nested structure would correlate with the proportion of infected individuals for each of the pathogens detected (high prevalence expected at top of the graph); however, we see no evidence of this (b). The five species most characteristic of cropland and pastoral habitats are highlighted in gold, whereas the five species most characteristic of conserved and exclosure habitats are highlighted in green.

