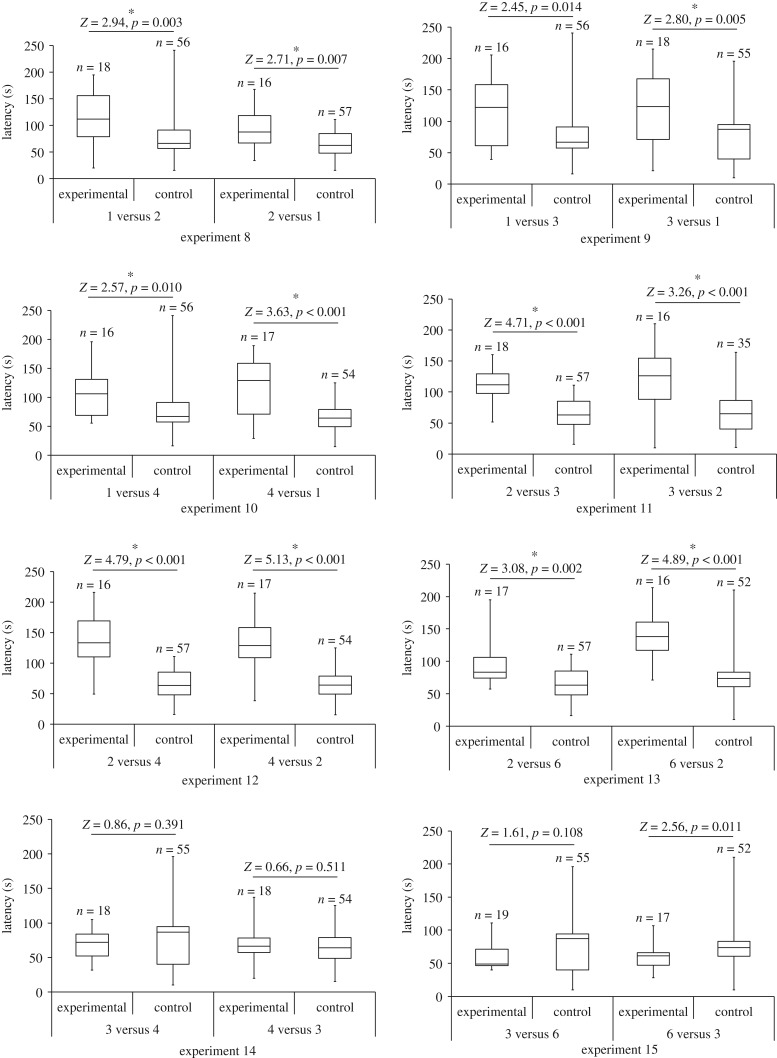
Figure 4.
Latency (time elapsing between test spider (Portia africana) arriving at the top of the Viewing Tower and crossing the Access Ramp). Experimental: prey number visible from top of Viewing Tower different from prey number visible from top of Starting Tower. Control: prey number visible from top of Viewing Tower same as prey number visible from top of Starting Tower. In all experiments, prey arrangement and prey size was constant. Boxes show medians and upper and lower quartiles, and whiskers show minimum and maximum values. See table 2 for details of each experiment.

