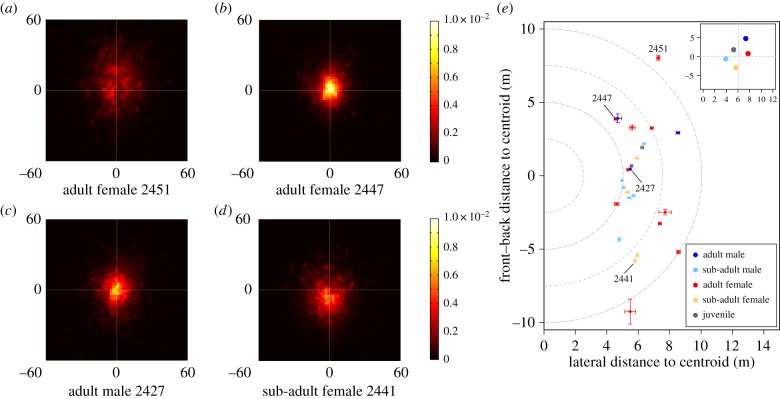
Figure 1.
Individuals exhibited markedly different patterns of spatial positioning within the group. (a–d) Histograms showing the probability of occupying a given position relative to the group (colour) for four different individuals. The origin of each plot indicates the troop centroid (white point), and the positive y-axis points in the direction of troop movement. Individuals had consistent positioning patterns that ranged from peripheral (a) to central (b,c) and from front (a) to back (d). Differences in spatial position were consistent across days (electronic supplementary material, figure S3), including mean front/back and lateral position (shown for all individuals in (e), bars are standard errors of the mean). Inset shows the age–sex class averages. Class-level results indicate that adults typically occupied more frontal and lateral positions, while subadults and juveniles were typically more central and found towards the back of the troop. (Online version in colour.)

