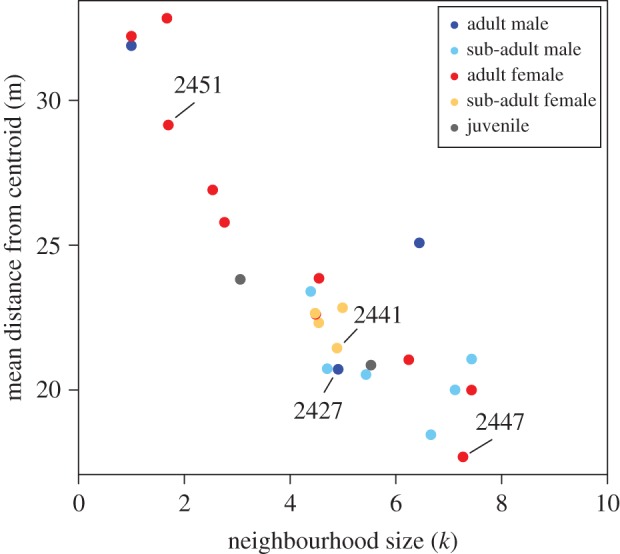
Figure 2.

Individuals with a large neighbourhood size are typically found closer to the troop centroid. Each point represents an individual's mean distance from the troop centroid (figure 1) and its neighbourhood size (mean value of k that generates the most accurate location prediction for that individual across all time lags). The four individuals shown in figure 1 are also labelled here (text labels). (Online version in colour.)
