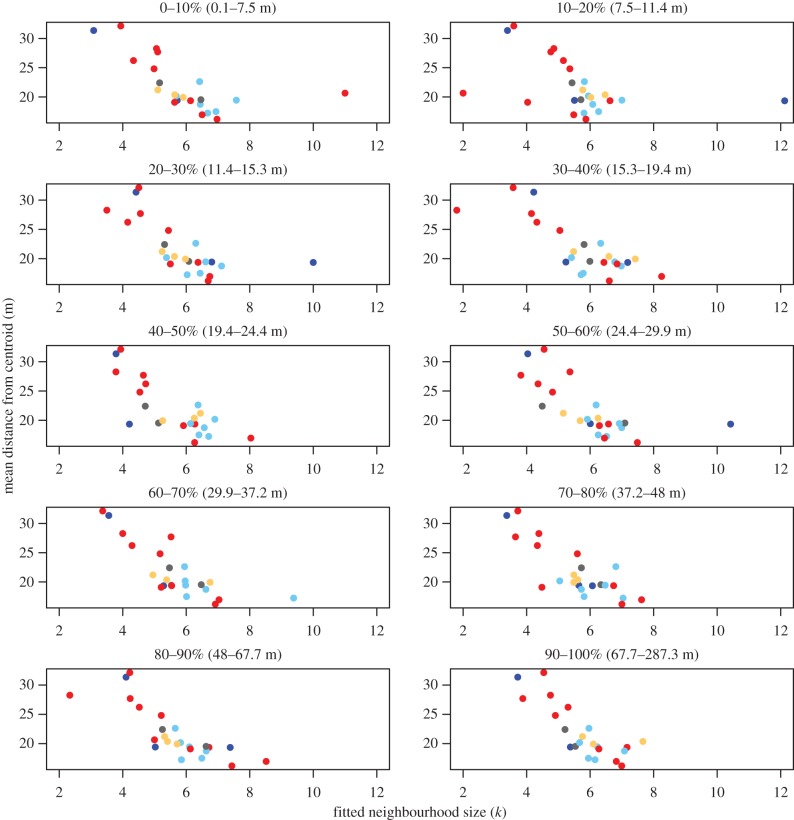
Figure 3.
The relationship between an individual's neighbourhood size and its mean distance from the troop centroid persists regardless of its distance from the troop centroid at the time of the prediction. Each plot shows the mean optimal value of k for each individual (x-axis), computed based only on data from when the individuals were located within a specified range of distances from the troop centroid (top labels). Distances from the centroid are binned based on 10% quantiles (i.e. the top left panel represents data from each baboon when they were in the lowest 10% of distances from centroid). In all cases, data show a negative relationship, indicating that individuals that are found on average closer to the centroid have a larger neighbourhood size regardless of where they are currently. This negative relationship is also maintained if ranked distances from the centroid are considered rather than absolute differences (electronic supplementary material, figure S6). In addition, fitted neighbourhood sizes are relatively consistent within an individual regardless of its current location (see also electronic supplementary material, figure S5). (Online version in colour.)

