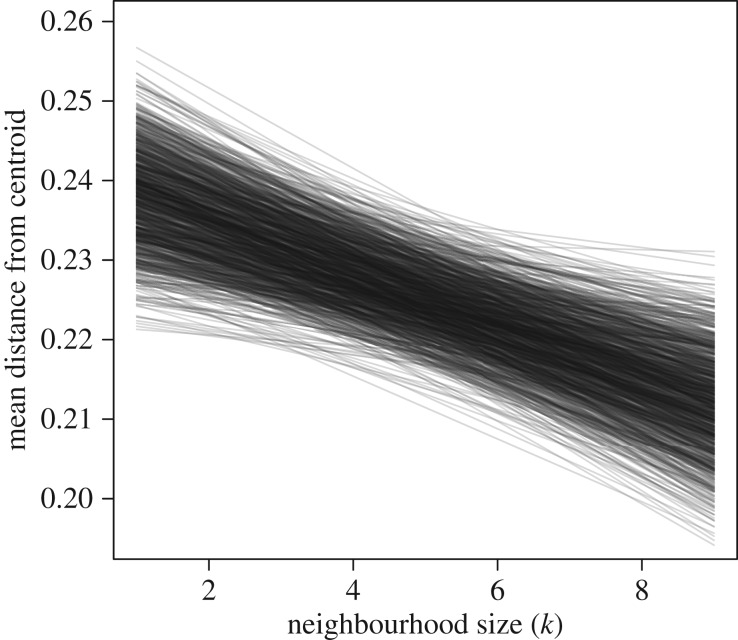
Figure 4.
Results from a simple simulation replicate the relationship observed in the data. After simulating movement of 25 individuals in one-dimensional space using the same distribution of neighbourhood sizes as observed in the data (figure 2), those individuals with a larger neighbourhood size were typically found closer to the group's centroid. Each simulation consisted of 1000 samples, and we recorded each individual's mean distance from centroid across all samples. Each line represents the relationship between neighbourhood size and distance from centroid from a single simulation. The units of distance are arbitrary. Similar results were obtained using a two-dimensional model (electronic supplementary material, figure S8).

