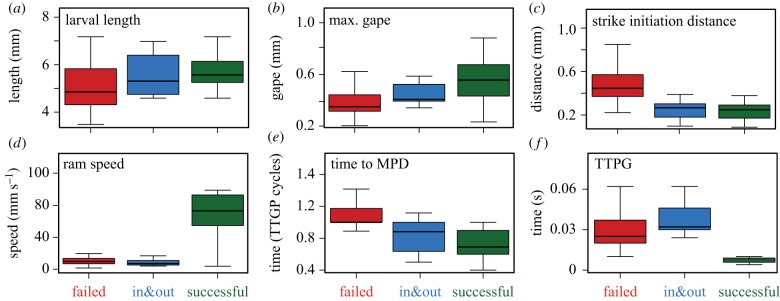
Figure 2.
Strike outcomes and their kinematics: kinematics of ‘failed’ (red), ‘in&out’ (blue) and ‘successful’ (green) feeding attempts. Data were obtained with the three-dimensional high-speed system (n = 93 strikes; electronic supplementary material, table S2). For visualization purposes, data are pooled for all ages. Boxes encompass the range between first and third quartile, whiskers span 1.5 inter-quartile range; the horizontal line within each box is the median. MPD in (e) denotes minimal prey distance; TTPG in (f) is time to peak gape. (Online version in colour.)

