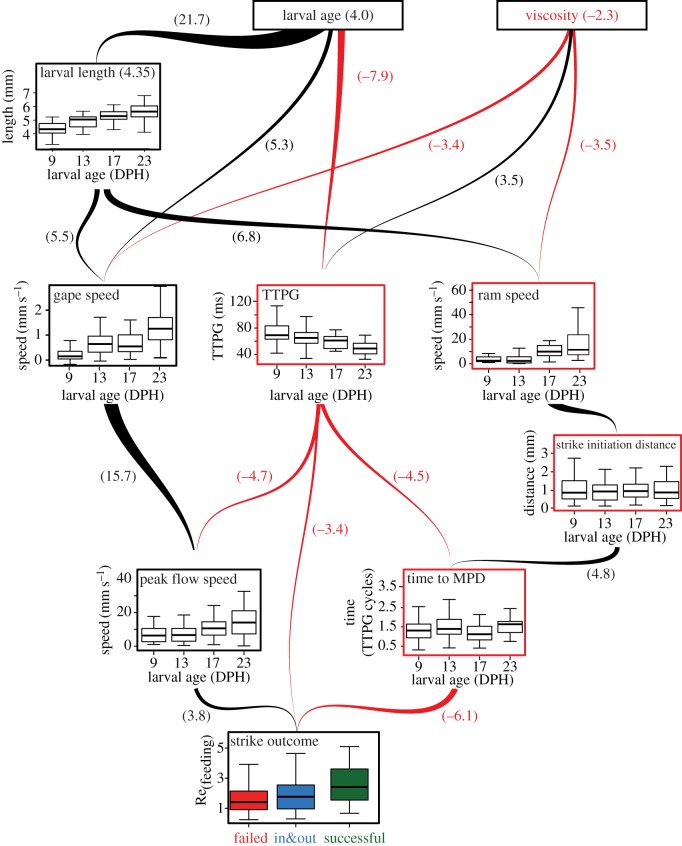
Figure 4.
Path analysis indicates strike success is mediated through multiple interacting m-p traits. Black and red arrows represent statistically significant positive and negative paths, respectively. Red and black panel frames represent positive and negative total effects of each variable on strike outcome. The effect size of each path (arrow) is denoted by the bracketed values and arrow width (see electronic supplementary material, tables S5–S7). Strike outcome was directly determined by peak flow speed, TTPG and time to MPD. Increasing larval age/length decreased TTPG and increased ram and gape speeds, while viscosity had opposite effects on these variables. Total effect sizes (the sum of all direct and indirect paths) of larval age, length and viscosity are denoted near variable names. Boxes encompass the range between first and third quartile, whiskers span 1.5 inter-quartile range; the horizontal line within the box is the median. (Online version in colour.)

