
Figure 2.
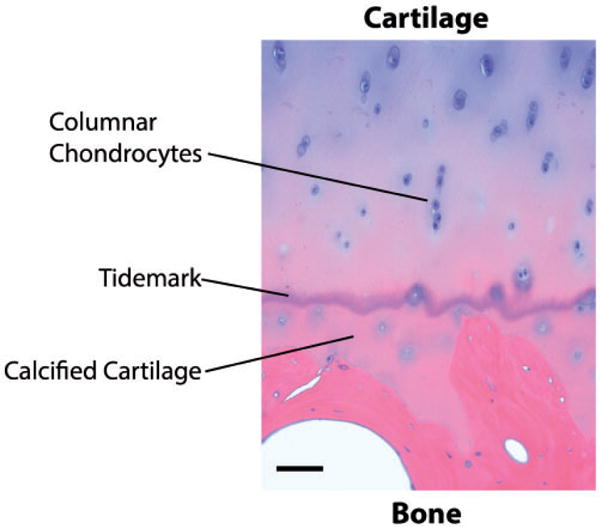
Hematoxylin and eosin (H&E) staining of a section of native osteochondral tissue in which tidemark, calcified cartilage and columnar chondrocytes are highlighted as prominent features in the osteochondral junction. Bar = 100 μm. (A color version of this figure is available in the online journal.)