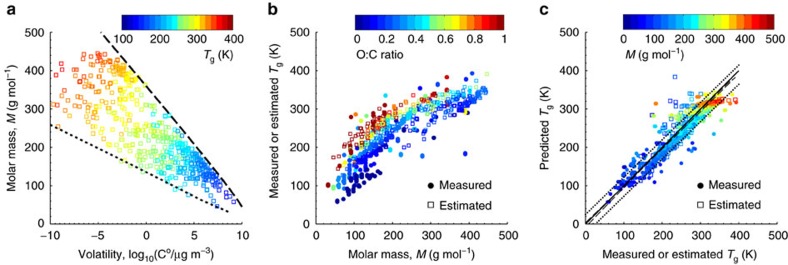
Figure 1. Characteristic relations between molecular properties and glass transition temperature of organic compounds.
(a) Molecular corridor of molar mass plotted against volatility of 654 SOA compounds17 colour-coded by glass transition temperature (Tg) estimated with the Boyer–Kauzmann rule5. The upper dashed line indicates the low O:C bound of the molecular corridor (linear alkanes CnH2n+2 with O:C=0), the lower dotted line indicates the high O:C bound (sugar alcohols CnH2n+2On with O:C=1). (b) Measured (circles) and estimated (squares) Tg of organic compounds plotted against molar mass. Organic compounds with measured Tg are from Koop et al.5 and Dette et al.51. The markers are colour-coded by molecular O:C ratio. (c) Predicted Tg using a parameterization developed in this study compared to measured (circles) and estimated (squares) Tg with the Boyer–Kauzmann rule. The solid line shows 1:1 line and the dashed and dotted lines show 68% confidence and prediction bands, respectively.

