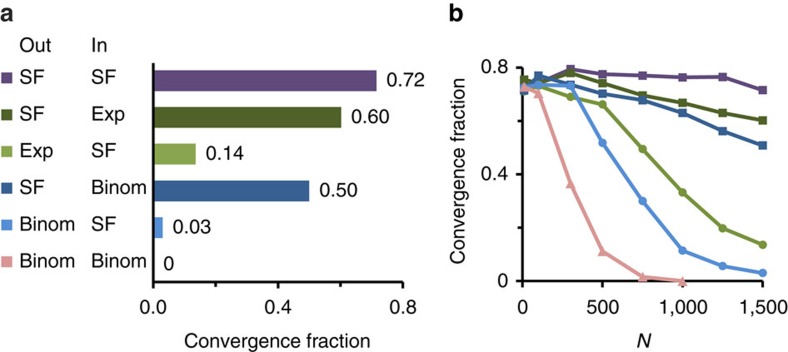
Figure 2. Convergence fractions depend on network topology.
(a) Seven ensembles of networks of size N=1,500 and different topologies exhibit remarkably different convergence fractions (CFs). Ensembles are characterized by the out- and in- degree distributions of the adjacency matrix T: ‘SF', scale free distribution; ‘Exp', exponential distribution; ‘Binom', Binomial distribution. (b) CF as a function of network size for the same ensembles of (a) with matching colours. N=1,500, y=0, g0=10, D=10−3. Parameters for degree distributions: SF, (a=1, γ=2.4); Binom,  ; Exp, (β=3.5).

