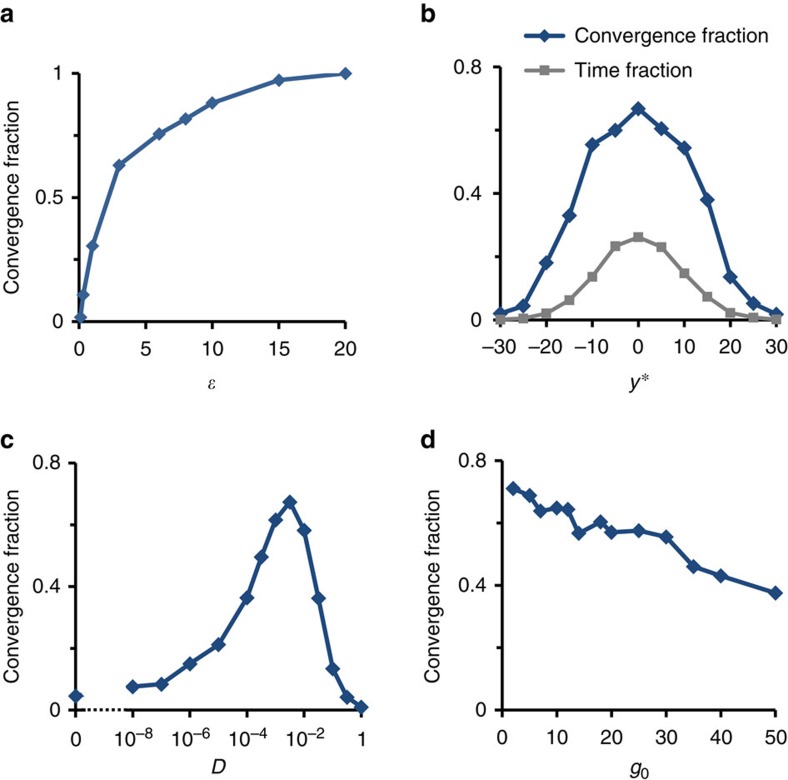
Figure 5. Dependence of CF on model parameters.
(a) CF versus ɛ, the width of the comfort zone around y*. (b) CF (blue) versus the constraint value y. For comparison, the grey curve shows the fraction of time in which y(t) spontaneously reaches the constraint-satisfying range. (c) CF versus the strength of exploratory random walk in connection strengths, D. (d) CF versus g0 (proportional to the s.d. of connection strengths; see Methods for details). Network ensemble with SF-out (a=1, γ=2.4) and Binom-in  degree distributions. Unless otherwise specified, all ensembles have N=1,000, y*=0, g0=10, and D=10−3.

