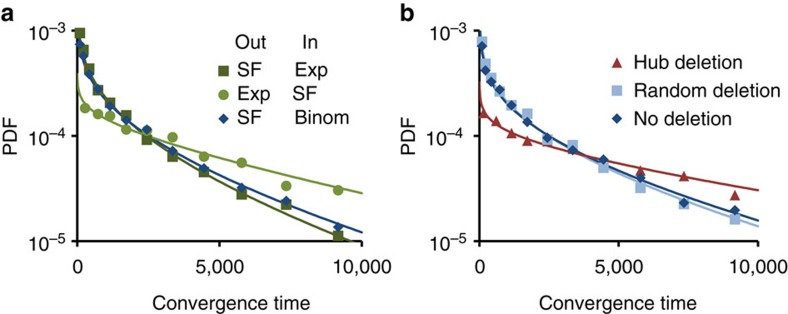
Figure 6. Distribution of convergence times for networks which converged in less than 104 timesteps.
Solid lines depict stretched exponential fits. (a) Probability density distribution (PDF) of convergence time for three topological ensembles. (b) PDFs after deleting the 8 largest hubs (red) or the same number of randomly-chosen nodes (light blue) from the SF-Binom ensemble. All ensembles have N=1,000, y=0, g0=10, and D=10−3. Degree distribution parameters: SF, (a=1, γ=2.4); Binom,  ; Exp, (
 ).
).

