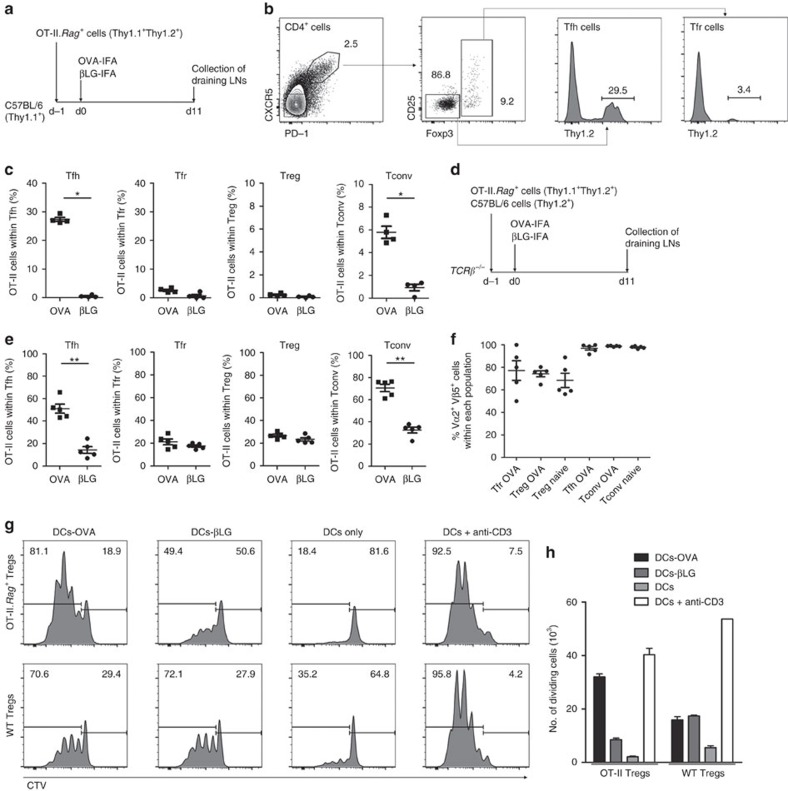
Figure 2. No preferential accumulation of OVA-specific cells within the Tfr population.
(a) 107 CD4+ T cells from OT-II.Rag+ mice were transferred into C57BL/6 hosts, subsequently immunized with OVA-IFA or βLG-IFA in the footpad. (b) Popliteal LNs were analysed for the presence of OT-II.Rag+ TCR-transgenic cells within Tfh and Tfr populations based on Thy1.2 staining. Tfh cells were defined as CD4+CXCR5+PD-1+Foxp3− and Tfr cells as CD4+CXCR5+PD-1+Foxp3+. The same gating strategy was applied on Treg (CD4+CXCR5−PD-1−Foxp3+) and Tconv (CD4+CXCR5−PD-1−Foxp3−) cells to determine the percentage of Thy1.2+ OT-II.Rag+ TCR-transgenic T cells within those two populations. (c) OVA-specific TCR-transgenic cells were over-represented within Tfh and Tconv populations in mice immunized with OVA (*P<0.05 using two-tailed non-parametric Mann–Whitney U-tests). Within Tfr and Treg cells there was no significant increase in OVA-specific cells in mice immunized with OVA, compared to βLG-immunized animals. (d) An equal number (107) of CD4+ T cells from OT-II.Rag+ and C57BL/6 mice were transferred into T-cell-deficient TCRβ−/− mice, subsequently immunized as described above. (e) Under these conditions there was an even greater representation of OVA-specific cells within Tfh and Tconv populations (*P<0.05 and **P<0.01 using two-tailed non-parametric Mann–Whitney U-tests). Although ∼20% of Tfr cells derived from the OVA-specific TCR-transgenic population, that frequency remained similar in mice immunized with OVA or βLG. Similar results were obtained in two additional independent experiments, all with n=5. (f) Frequency of Vα2 Vβ5 double-positive cells within Tfr, Treg, Tfh and Tconv populations from naive or OVA-immunized mice. (g) Fluorescence-activated cell sorting-purified C57BL/6 and OT-II.Rag+ Treg (CD4+CD25+GITR+) cells were labelled with CellTrace Violet (CTV) and cultured for 3 days in presence of IL-2 and bone marrow DCs loaded with OVA or βLG. In control groups T cells were cultured with unloaded DCs with or without soluble anti-CD3. Histograms are representative of Treg (CD4+TCRβ+CD25+Foxp3+) cell proliferation at the end of the culture. (h) Quantification of the number of proliferating cells. Culture triplicates are presented on the histogram and are representative of three independent experiments. Mean±s.e.m. are presented in all graphs.

