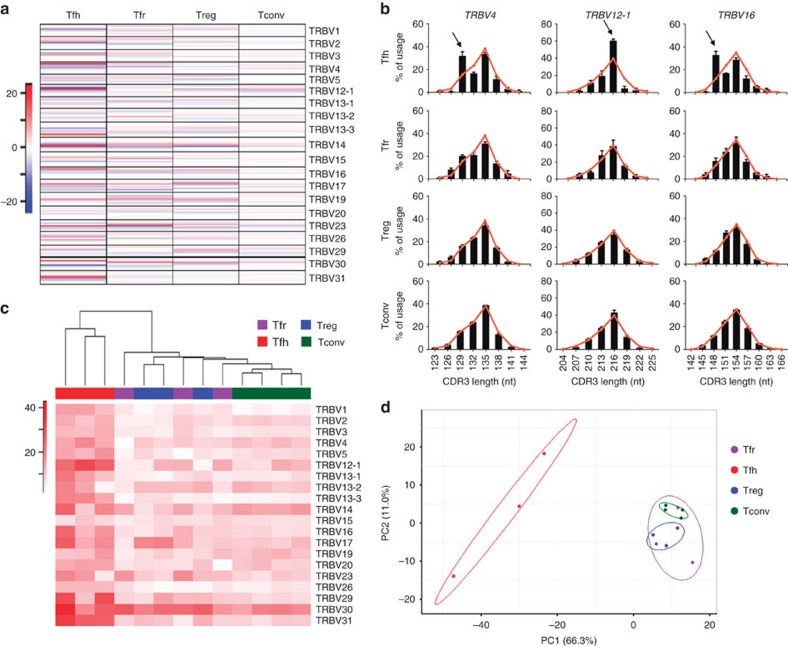
Figure 5. Tfh cells display antigen-induced oligoclonal proliferation that is absent from Tfr cells.
(a) Heatmap showing the differences between the percentage of usage for each CDR3 length of each TRBV of Tfh, Tfr, Treg and Tconv populations compared to the Gaussian-like distribution of CD4+ naive T cells (used as a control population). Similar TRBV CDR3 length frequencies (compared to control population) are displayed in white, while higher/lower frequencies of specific CDR3 lengths are represented, respectively, in red and blue. The heatmap is representative of, at least, three independent experiments per population. (b) Distribution of CDR3-length usage for three representative TRBV segments where greatest variation is observed. Bars represent CDR3-length usage distribution for indicated populations, with the reference values (naive CD4+ T cells) superimposed in red. Arrows indicate over-representation of a specific CDR3 length on Tfh cells, a putative consequence of clonal selection and expansion. Neither Treg nor Tfr cells show similar expansions (bar graphs below). Mean±s.e.m. are represented on the bar graphs. (c) Hierarchical clustering of the samples from the four populations based on their TRBV perturbation scores, calculated using the Tfr group average as reference. Heatmap colour code indicates variations of TRBV scores between each sample and the average of Tfr group, while the dendrogram shows distance between sample populations. (d) Replicates from different T-cell subsets were projected according to the first two PCA components. Tfh samples are apart from all the other subsets. In all panels, for each T-cell population, we used at least three independent replicates, each one with cells sorted from 10–15 mice.

