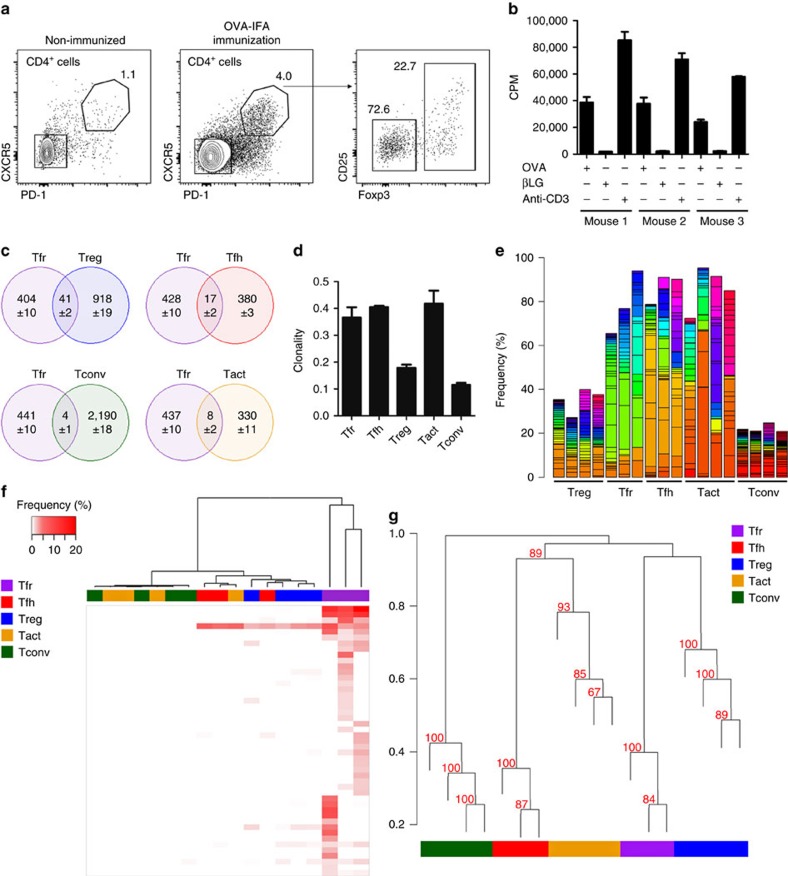
Figure 6. Deep sequencing analysis unveils a different repertoire between Tfr and Tfh cells.
(a) Frequency of follicular CD4+CXCR5+PD-1+ T cells on popliteal LNs of 1D2β mice before (left), and 11 days after OVA-IFA immunization (middle), when both Tfr and Tfh cells are present (right). (b) Proliferation of Tfh cells from OVA-IFA-immunized 1D2β mice cultured with DCs pulsed with OVA or βLG (anti-CD3 was used as positive control). Cell proliferation was measured by 3H-thymidine incorporation. Mean±s.e.m. of culture triplicates are presented and are representative of two independent experiments. (c) Venn diagrams showing the number of shared clonotypes between Tfr cells and the other four populations for mouse 1. Numbers are the mean±s.d. of clonotypes identified after 100 iterations of the sampling process. Tfr cells have more common clonotypes with Treg cells than any other cell population. (d) Clonality score for the five populations. (e) Histogram of cumulative frequency across all samples of the union of the 20 most predominant clonotypes for each sample. Each colour corresponds to a unique clonotype. (f) Heatmap and hierarchical clustering of the 20 most predominant clonotypes of Tfr replicates across all samples. Tfr most predominant clonotypes are mostly shared with Treg samples, with the exception of one sequence that is common with Treg and Tfh samples. (g) Dendrogram showing the overall relation of all sequenced samples using Horn–Morisita index distance method. Bootstrap resampling was performed to calculate approximately unbiased (AU, in red) P values for each cluster. In the case of the Tfr and Treg cluster, AU=96% thus the existence of the cluster is strongly supported by the data. For sequencing data, histograms present mean±s.e.m. for n=4, except for Tfh and Tfr where n=3.

