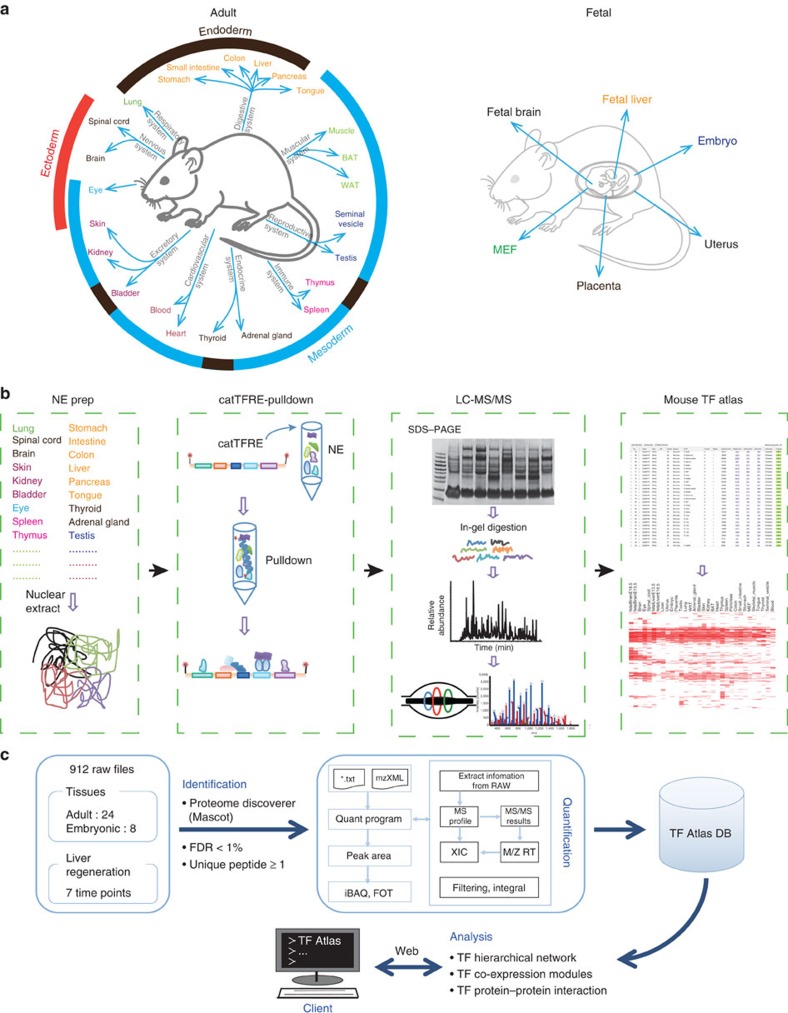
Figure 1. Overview of the mouse tissue TF atlas workflow.
(a) The 24 adult mouse tissues and 8 fetal tissues analysed to generate a draft map of the mouse TF atlas are shown. The same font colour indicates that the tissues are from the same physiological system. The ambient arcs show the layers from which the tissues developed. Red: ectoderm; Blue: mesoderm; Brown: endoderm. (b) Nuclear extract (NE) were prepared from each tissue, and then the catTFRE pull down was carried out and analysed by LC-MS/MS to obtain the primary data. (See the Methods section for details). (c) The data were analysed with a homemade platform and stored in the mouse TF atlas database. (See the Methods section for details).

