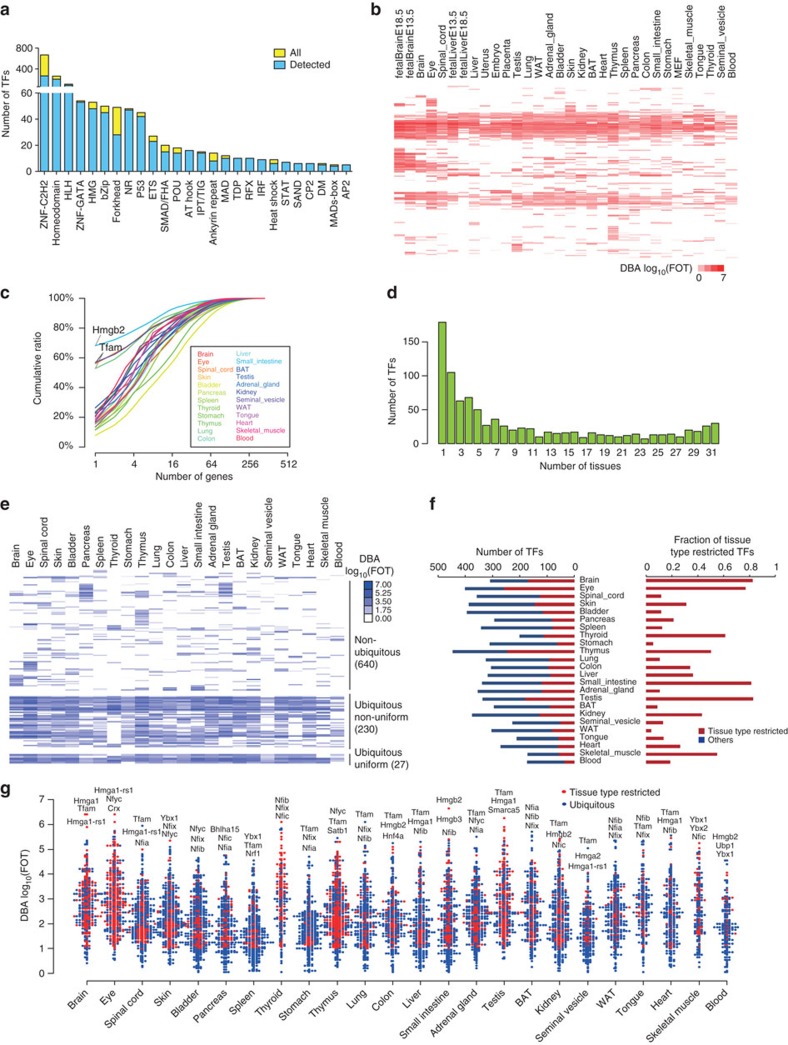
Figure 2. TF identifications in 24 adult and 8 fetal mouse tissues.
(a) Number of TFs identified in each TF family. The TFs were classified into families according to their DNA-binding domains. TFs with multiple DBDs were classified in each of their respective families. The number of TFs in each family that was detected using the catTFRE strategy is plotted. (b) Heatmap of TF DNA-binding activity in 24 adult mouse tissues and 8 fetal tissues; the TFs are shown in the rows, and the tissues are shown in the columns. DBA: DNA-binding activity. (c) Cumulative protein abundance from the highest to lowest in the 24 adult tissues. (d) Number of tissues in which the TFs are expressed. (e) Heatmap for non-ubiquitous (71.3%), ubiquitous-uniform (3.1%) or ubiquitous non-uniform (25.6%) TF. The colour bar on the right indicates the relative expression abundance. (f) The number of tissue restricted TFs (ttrTFs) and their fractions in total TFs in different tissues. (g) Distributions of ubiquitous and ttrTFs and their relative abundances in 24 adult tissues. The abundance of the TFs spans almost seven orders of magnitude. The names of the top three most abundant TFs are listed.

