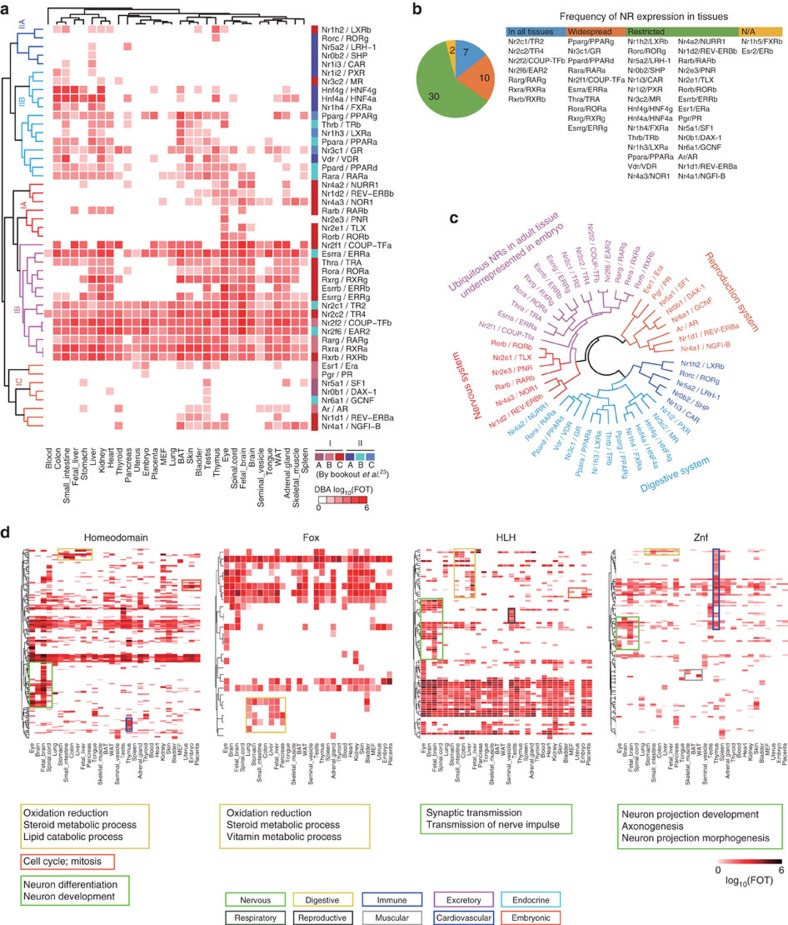
Figure 3. Global profiling of TF families in mouse tissues.
(a) Unsupervised hierarchical clustering of DNA-binding activities of nuclear receptors (NRs) and the comparison with mRNA expressions. NRs were grouped into two main clusters (I and II) and five sub-clusters (IA, IB, IC, IIA and IIB). The comparison with mRNA is shown on the right colour block. (b) Statistics of NR expressions in different tissues. The number of NRs expressed in various tissues is indicated in the pie chart. Seven NRs were expressed in all tissues, ten NRs were expressed in more than half of but not all tissues and were labelled ‘widespread', and 30 NRs were restricted to less than 50% of tissues and were named ‘restricted'. (c) The ‘NR Ring of Physiology' derived from DNA-binding activity. The dendrogram is depicted based on the hierarchical clustering, revealing NR clusters in different tissues. (d) Unsupervised hierarchical clustering of other TF families. Blocks with different colours represent different physiological systems. The annotations in the blocks are the GO enrichment terms for the TGs that were co-regulated by at least two TFs in the block.

