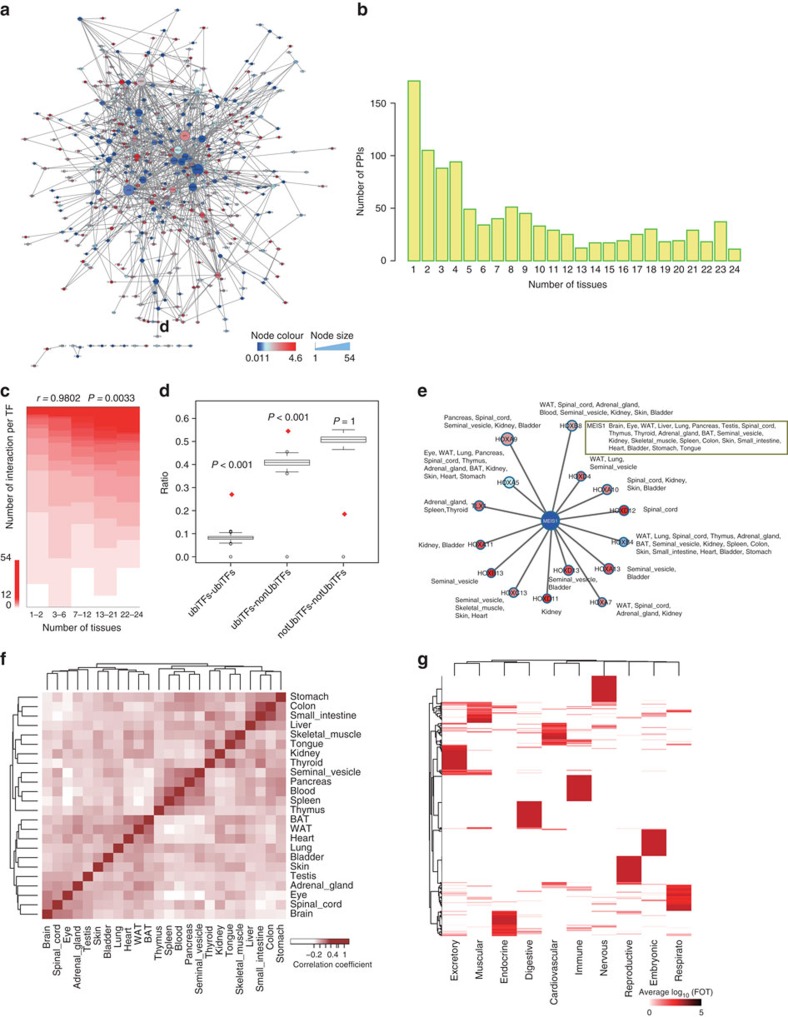
Figure 5. TF interaction network and specific TF expression patterns in physiological systems in mouse tissues.
(a) Interaction network of all TFs in the 24 tissues. The colours indicate the tissue-specificity score (TSPS), and the node size shows the number of PPIs of the TF. (b) The numbers of TF–TF interactions that were detected in different number of tissues. More than 150 TF–TF interactions were detected in one tissue and only 11 TF–TF interactions were detected in all 24 tissues. (c) The negative correlation between tissue specificity and the number of TF–TF connections. The TFs were binned into five groups of approximately equal size based on tissue specificity (x axis). The stacks of coloured segments represent the number of interactions for each bin. (d) Statistical significance of different types of protein–protein interaction, calculated using 1,000-time permutation test. Centre line and box limits represent median value and lower or upper quartile, respectively. Whiskers show the range of lower quartile −1.5-fold IQR to higher quartile +1.5-fold IQR. (e) TF interactions between Meis1 and Homobox TFs in different tissues. As a facilitator hub, Meis1 interacts with different TFs in the Hox family in different tissues, showing the specificity of the interaction was determined by Homobox TFs, namely the ttr TFs. (f) Heat map showing the pairwise correlations between all 24 adult tissues based on DNA-binding ability. The TF expression patterns are similar between tissues of the same physiological systems. (g) Clustering of the top 30 most enriched TFs in the ten physiological systems to identify TFs that can specify the biological systems.

