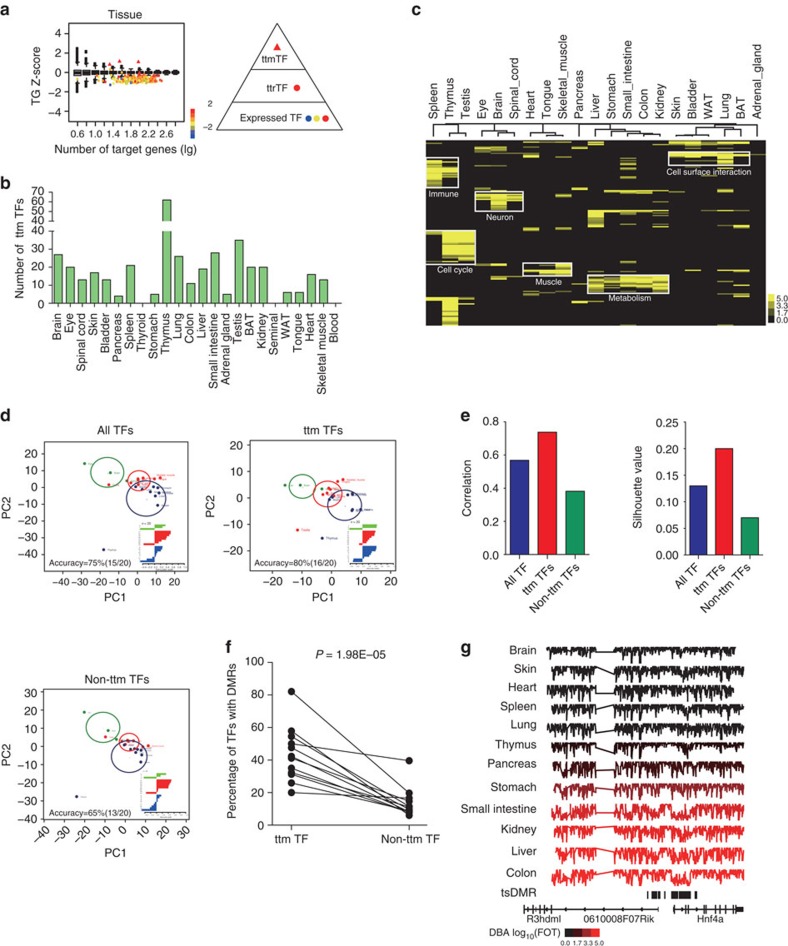
Figure 6. Identification of tissue-type maintenance transcription factors (ttmTFs) and their fundamental features.
(a) ttmTFs for each tissue are identified with high Z-scores (>1) and TG Z-scores that are higher than those from random data. x axis represents the number of target genes; y axis represents the average TG Z-scores. Network of TFs with a three-tiered organization was shown on the right. (b) The number of identified ttmTFs in the 24 adult tissues. (c) Heat map for the Reactome terms that were enriched in the TGs that were regulated by at least two ttmTFs in each adult tissue. (d) PCA demonstrated that the ttmTFs exhibited the highest accuracy in separating the tissues from the ectoderm, mesoderm and endoderm lineages. Plus signs indicate the cluster centroids. The radius of the circle indicates the average distance from the centroid. The silhouette value was used to measure separation between the three tissue classes. Accuracy was defined as the ratio of tissues with silhouette value more than zero. Green: ectoderm; Red: mesoderm; Blue: endoderm. (e) The correlation between PC1 and ‘blastoderm' information (left) was the highest using ttmTF set. The silhouette value (right) was used to measure how similar an object is to its own cluster (cohesion) relative to the other clusters (separation). (f) The ratios of promoters to the tissues' tsDMRs for both ttmTFs and non-ttmTFs. The 1,000-time permutation test was performed. (g) DNA methylation maps near the Hnf4a locus in 12 adult mouse tissues. Each track spans percent mCG (%mCG) values between 0 and 100%. The tracks include two tissues from ectoderm, four tissues from mesoderm and six tissues from endoderm. The tissues were ordered according to Hnf4a DNA-binding activities (increasing). The colour bar indicates the TF DNA-binding activities in log10(FOT).

