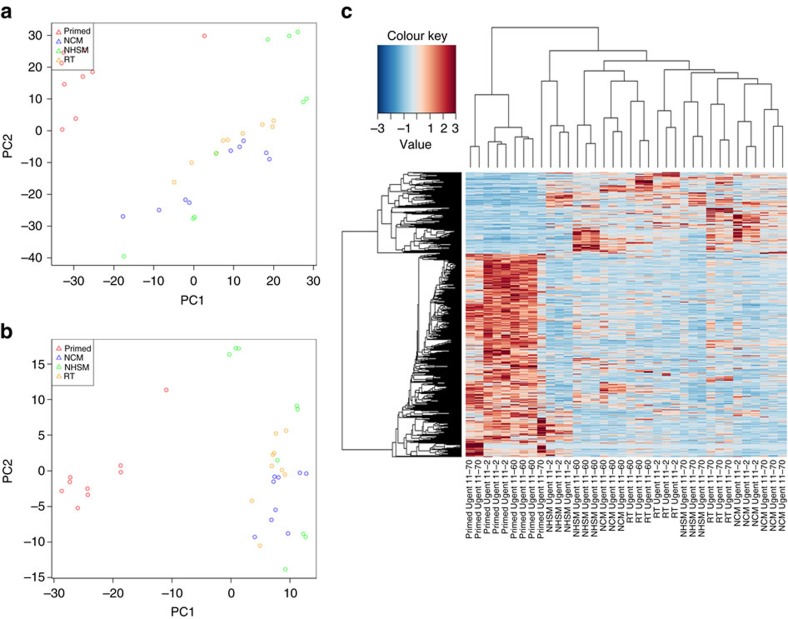
Figure 5. Genome-wide expression analysis of parental primed hESC and converted naive hESC in different conversion conditions.
(a) PCA based on normalized transciptome data. (b) PCA based on rlog values of the differentially expressed genes (FC> 2, FDR<0.05) between primed hESC and all naive hESC. (c) Hierarchical clustering and heatmap of differentially expressed transcriptome data between parental primed and all naive hESCs.

